Significant Digits
The advent of computers and calculators in the 1970s has led to an explosion of supposedly significant digits far beyond the justifiable precision of a calculation. Anyone recall when “2 + 2 =” gave a result of 3.9999999 … and that number was faithfully believed?
The number of significant digits is determined by the precision of the measurement; the measure is precise only to the degree defined by the least significant digit: a measure of 12.34 is precise to 0.01 – but the true value may lie between 12.335 and 12.345 (or the “true” value may be nowhere close to this if the measurement instrument is inaccurate).
This reading has four significant digits, precision of 0.01, and uncertainty of ±0.005. The meter might have resolution of 0.000001 (1 ppm) but there is nothing in this reading, its precision, or the resolution that implies any degree of accuracy.
A basic refresher:
A measurement can be very precise – but not accurate.
A measurement can be very accurate – but not precise.
A valid measure is both accurate and precise.
If many measurements give the same result, it is precise. If those results are the true value, they are accurate as well.
If many measurements give widely varying results with an accurate average value, the (cumulative) measures are accurate but not precise.
Resolution has no relation to accuracy – other than limiting its representation. Precision may be less than resolution but can not be greater (the measure may be precise to 0.01 with resolution of 0.0001 but can not be precise to 0.0001 if resolution is only 0.01)
Unless the measurement instrument is properly characterized (“calibrated”), it is impossible to define the accuracy or precision of any single given measure. Resolution is a function of the measurement instrument and not the measure. In the binary world, the resolution is defined by the number of bits. The measurement can not be more precise than the value of 1 bit … but it can be less precise.
If [x] has uncertainty ![]() then true x may lay between x ±
then true x may lay between x ± ![]() /2.
/2.
Although there are several methods of rounding, “round to nearest, tie to even” is the default method for both floating point computation and decimal arithmetic. 3.5 and 4.5 both round to 4. 5.4 becomes “5”; 5.5 becomes “6”.
A given numerical value with no decimal such as “2” is assumed exact. A numerical value such as 2.7183 is assumed accurate to the number of decimal places with the true value assumed to be between 2.71825 and 2.71835 (The uncertainty is assumed ±0.00005 … or ±50 ppm). There is no “exact” value for this number, but the precision can exist beyond one’s point of caring.
When used in “scientific notation”, this number can be expressed as 2.7183 × 10o. The number of significant digits is clear (5) and precision is implied to be 0.0001 (or 100 ppm). This convention holds if the number expressed were 2.7000 ![]() 10o; there are still 5 significant digits (why would 2.7000 have any fewer significant digits than 2.7001?) – as opposed to the representation as 2.7
10o; there are still 5 significant digits (why would 2.7000 have any fewer significant digits than 2.7001?) – as opposed to the representation as 2.7 ![]() 10o where there are only 2 significant digits. The first has precision to 0.0001; the second to 0.1 even though they appear to be the same number.
10o where there are only 2 significant digits. The first has precision to 0.0001; the second to 0.1 even though they appear to be the same number.
This type of expression is often used when coding binary numerical representation (which may separate the mantissa and exponent representation).
To 18 places, the “exact” value is ![]() . The precision is 1e-18, the resolution is also 1e-18. However, if the measured value was
. The precision is 1e-18, the resolution is also 1e-18. However, if the measured value was ![]() , the value would only be accurate to 4 places even though the resolution remained 1e-18. All values to the left of the first “3” are invalid and contribute uncertainty if carried through later calculations … which would in themselves have no better – and possibly worse – accuracy than 5 significant digits. While the speed of light has an exact magnitude of 299 792 458, in this situation it would properly be represented in calculations as 2.9979e8.
, the value would only be accurate to 4 places even though the resolution remained 1e-18. All values to the left of the first “3” are invalid and contribute uncertainty if carried through later calculations … which would in themselves have no better – and possibly worse – accuracy than 5 significant digits. While the speed of light has an exact magnitude of 299 792 458, in this situation it would properly be represented in calculations as 2.9979e8.
Consider a measure of mass and volume. The density is calculated as:
![]()
Measurements are made: the mass is measured as 2.34 g and the volume is measured as 5.6 cm3.
The density is not:
![]()
This result implies a much greater precision than the measures can justify.
When multiplying or dividing, the answer is no more precise than the least precise term: the density can be properly stated as:
![]()
When adding or subtracting, the correct result is precise to the precision of the least precise measure:
![]()
This can become an issue when digital representations of phenomena are used for calculations.
The processing, storing, and transmitting excess digits represent a waste of resources …
Accuracy of Measurement
Accuracy represents the closeness of a measurement to the true value; precision represents the repeatability of that measurement. Resolution represents the fineness of the information (number of significant digits)
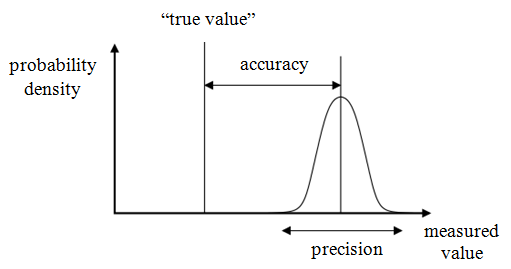
A set of measurements with high accuracy and low precision will be centered about the “true” value but will have samples widely spread. The system has poor repeatability and each individual measurement is a poor representation of the true value – but the average of many measurements will approach “truth”.
A measurement with low accuracy but high precision will be narrowly centered about the wrong value. The repeatability is high but each individual measurement is a poor representation of the true value. Averaging will not produce an improved result but system calibration might.
Consider a system in which the precision has been stated as ![]() 0.5%. This implies that any value within these limits is equally likely, equally valid, and equally accurate.
0.5%. This implies that any value within these limits is equally likely, equally valid, and equally accurate.
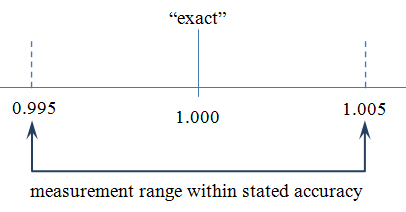
The measurement may be precisely wrong but it would be difficult to be imprecisely correct. Precisely wrong can be corrected – if the “wrongness” is known.
In the absence of additional knowledge, electronic components are purchased with a tolerance having uniform distribution within expressed limits – usually expressed as a percentage of a nominal value (the “mean”). In the illustration above, any single measure between 0.995 and 1.005 (“1.00 ![]() 0.5%”) is equally likely and equally correct. It would not be correct to express this measure as “1.00156”; the proper representation is “1.002” … or simply “1.00”
0.5%”) is equally likely and equally correct. It would not be correct to express this measure as “1.00156”; the proper representation is “1.002” … or simply “1.00”
Precision and accuracy are often difficult to separate. Consider a network built of 1% resistors. The manufacturer defines the resistor tolerance over a wide range of operating conditions but the absolute value of any one resistor may be equally of any value within ±1% of the nominal value. Is the network output error a result of poor accuracy or low precision?
If a single network is tested many times and the error is constant, the issue is accuracy. If many networks are built and tested with fluctuating errors, the issue is precision. If many networks are built and tested with nearly identical errors … but fluctuations are observed with changes in environment, the network itself may be precise but the measurement system is imprecise.
Averaging is a solution only for imprecise but accurate measures over a large number of samples – of the same measure. The averaging of imprecise and inaccurate measures will not improve the data quality. Calibration may aid accuracy – if the calibration is linear over the range of measured values. More sophisticated techniques may be required to correct for non-linear error functions.
A positive integer number of samples follows a Poisson distribution rather than Gaussian. The Poisson distribution approaches the Gaussian if sample numbers are high (averaging of samples having a Gaussian distribution has benefit). Something more than 10 for a reasonable approximation; something between 300 and 1000 samples for more “accurate” approximation – should such closeness be required. Keep in mind that although Gaussian approximations are often used, the data involved is rarely “pure”.
All of the above relates to measurements of “the same”. A set of resistors manufactured with the same process at the same time; a single resistor measured many times. A set of earth magnetic field measurements at a fixed location is non-stationary minute to minute but averaging may be applied as an integral of time. However, a set of earth magnetic field measurements at a variety of locations is non-stationary in both time and space and any averaging needs to account for both variations: the average intensity of the earth’s magnetic field over North Dakota was 35 Oe between the hours of noon and 3PM, on Oct 31, 1900. To simply say the average intensity of the earth’s magnetic field is 35 Oe without the qualifiers of space and time is misleading and incorrect; what’s to say it isn’t 45 Oe at Harvey, ND? or an average of 45 Oe over the state between the hours of noon and 3PM, on Nov 1, 1900?
Binary-to-Decimal
Since I’m talking numbers here with the intent of converting continuous functions to binary representations, a few words on the topic are appropriate.
For a binary number having N bits, the decimal representation is determined from:
![]()
where ![]() is the nth binary digit.
is the nth binary digit.
For example, consider the binary number “1101”. Applying the above formula:

There are many schemes for coding binary values. I’m only going to the edge of the digital world; the straight-forward binary count representation of the ADC output. For example, numbers with the MSB being 0 may represent negative numbers with those having MSB of 1 representing positive numbers. The means of representation of the ADC output is the border of a different world
Part 1
Part 3
That’s good for now.
![]()
Hold it. Wait a minute …
No, no, no. I can’t do it.
I’m sorry; I’m not allowed to skip it.
The discussion can’t be taken seriously without it.
I must include the mandatory “target” representation of precision, accuracy, and resolution.
Precise and Accurate
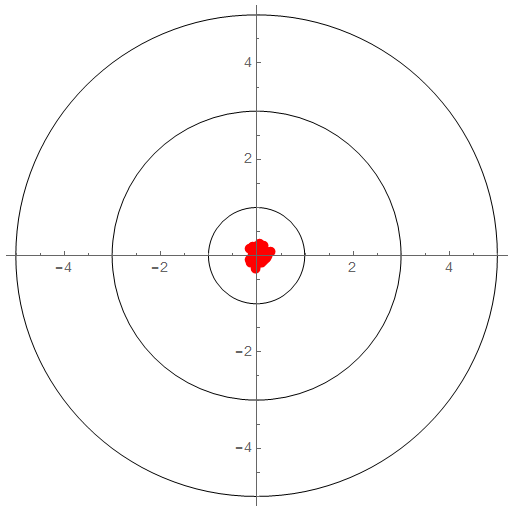
Precise but Inaccurate
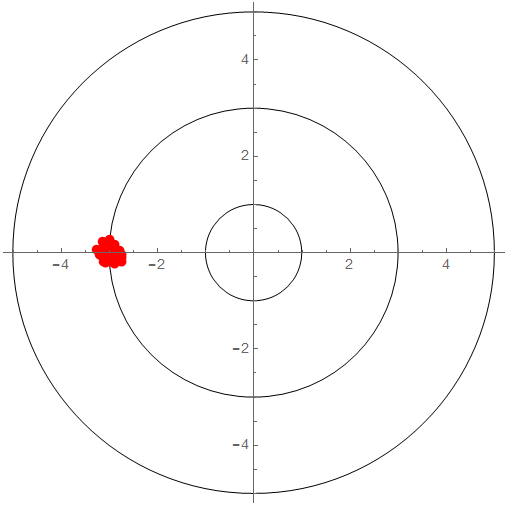
Imprecise but Accurate
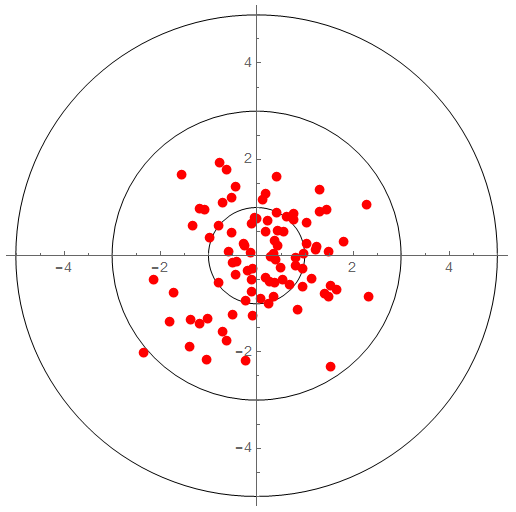
Imprecise and Inaccurate
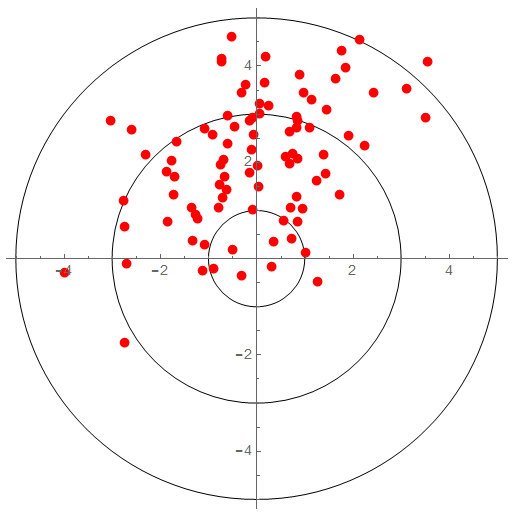
Imprecise and Inaccurate with Improved Resolution
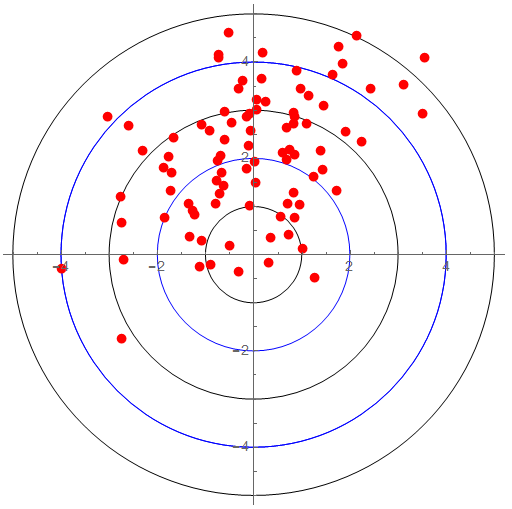
Increasing the resolution (or number of bits) gives me more numbers to play with but does nothing for the quality of the measure. If my measure of “1” is good to only 1 part per hundred, representing “1” to 1 part per thousand does nothing to improve precision or accuracy … though it would be easy to mislead the unknowing to that conclusion.