My professional interest has evolved over my career into what may be broadly classified as “measurement” – I like to believe I design measurement instrumentation with a particular focus on transducer interfacing – the portion of the signal chain from physical phenomena to the ADC output. I expand that interest into the phenomena which is to be measured – hence my Ph.D. in electromagnetic geophysics – and the associated power systems. Often overlooked is the effect the power supply has on signal integrity. Power supply rejection decreases with frequency and supply imperfections can distort the signal to be measured.
“Garbage In, Garbage Out” (GIGO) is still a truism: if the information is distorted before it is digitized, later interpretation of the data may be misleading and there is often no way to “fix” it later with numerical methods.
However, my focus with this discussion is the anti-aliasing filter.
A basic signal path might be represented in a form similar to:
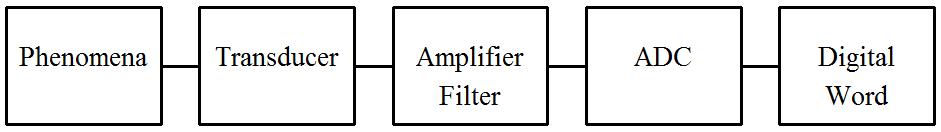
I’ll be looking into the “Amplifier/Filter” block. Although shown as a single block – because the filter is typically incorporated into a gain stage – I want to examine the mathematical representation of ideal filters. Such a discussion is applicable to both passive and active filters … and either can cause undesired effects on signal integrity.
So let’s get to it.
-
Filtering – Part 1
A continuous time signal such as that detected by a transducer will likely consist of a summation of sinusoidal functions as well as some degree of noise – which I’ll ignore herein. Each sinusoidal function will be of the form . When digitized, the resulting discrete function becomes where is the sample frequency and is…
-
Filtering – Part 2
I left off with the suggestion that a higher order filter could be used to ease attenuation limitations on amplitude measurements, so let’s look at a 4th-order Butterworth response. The 4th-order filter could be constructed with two 2nd-order sections in cascade. The normalized 2nd-order Butterworth function is: It follows that the 4th-order system…
-
Filtering – Part 3
The past two articles (Part 1, Part 2) were concerned with the magnitude response of the amplitude-optimized Butterworth filters. The Thomson filter – aka “Bessel” or “linear phase” filter – is optimized for a linear phase response in the passband. This also provides a uniform group delay – all frequencies within the passband are uniformly…
-
Filtering – Part 4
I left Part 3 indicating the Butterworth filter was superior in amplitude response and the Bessel in group delay response. To this point, the analyses have been in the frequency-domain … but measurements are made in the time domain (but may be converted to frequency domain for presentation such as in a spectrum analyzer). By…
-
Filtering – Part 5
To this point, I’ve been considering single-frequency sine waves but most signals consist of a “sum-of-sines”. Within this sum of sines, it is not uncommon for the phase relationships to be random with respect to each other. This can cause difficulty in making amplitude measurements. Consider this signal: The summation of two identical sine waves…
-
Filtering – Part 6
I left the last section with a moderately complex continuous-time waveform segment and a demonstration that a mathematically perfect signal with mathematically perfect Nyquist sampling indicates no frequency content. I know – you know – that in the engineering world, mathematically perfect doesn’t exist; “0” is very small, “∞” is very large – but both…
-
Filtering – Part 7
Consider a situation in which an airborne measurement platform travels in the x-direction while the measurement instrument scans between ±y centered about x. The instrument transmits several known frequencies and detects a return signal. The signal frequencies are such that the free-space wavelengths are a significant portion of the aircraft altitude. As the instrument sweeps…
-
Filtering – Part 8
Part 7 investigated signals of two frequencies with sinusoidal phase shift. For the most part, the sample frequency and data time length were constant; only the signal frequencies changed. Not unexpectedly, the lower frequencies were less affected by filter attenuation that were the higher frequencies which approached both the filter corner frequency and the Nyquist…
-
Filtering – Part 9
So .. I spent a lot of pages talking of filtering and the spectrum that results from the Fourier analysis of a time series. I actually used up a lot of space presenting lots of plots. Tired of plots yet? There’s only one on this last page. I used the two most common normalized filters…