I ended up far deeper in the weeds than I expected on this page. Furthermore, I had to scrape a lot of rust off whatever few mathematics brain cells I have left – I haven’t worked with Bessel functions in quite a while. I also re-discovered that not all reference papers are worthy – or correct. Shocked! Shocked I am!
But … here goes.
As the frequency increases, the current becomes concentrated towards the surface. This leaves the conductor center devoid of free electrons – the impedance of the conductor is based on the geometry of a ring rather than circle.

The area of the ring is found by determining the area of the larger circle (radius of ro) and subtracting the smaller circle (radius of ri) giving:
![]()
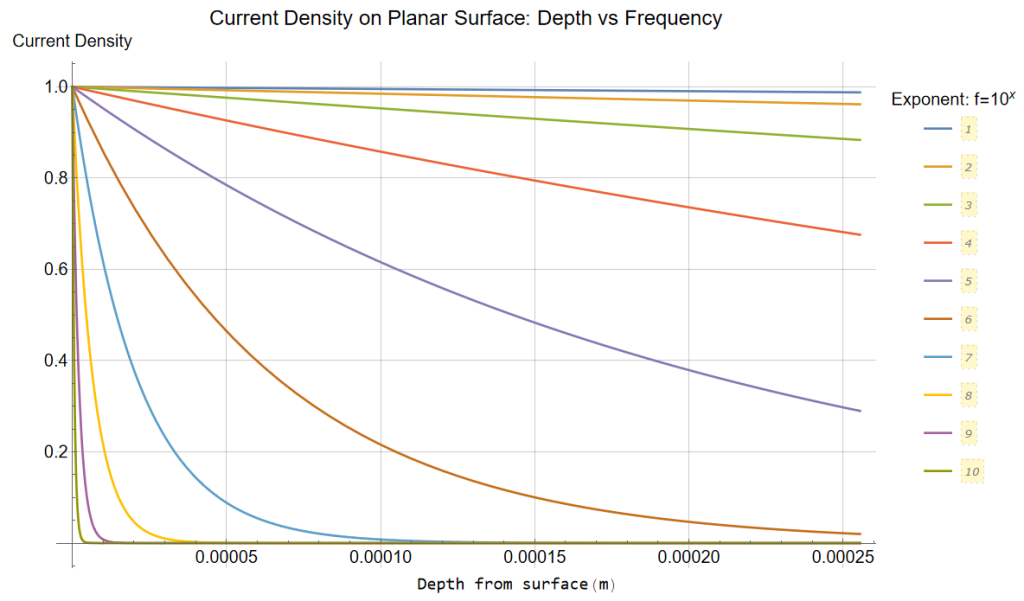
Current Density vs Depth on Planar Surface
Skin depth on a planar surface is defined as:
![]()
Defining skin depth as a function of frequency and plotting the attenuation per variations in depth gives results:
![]()
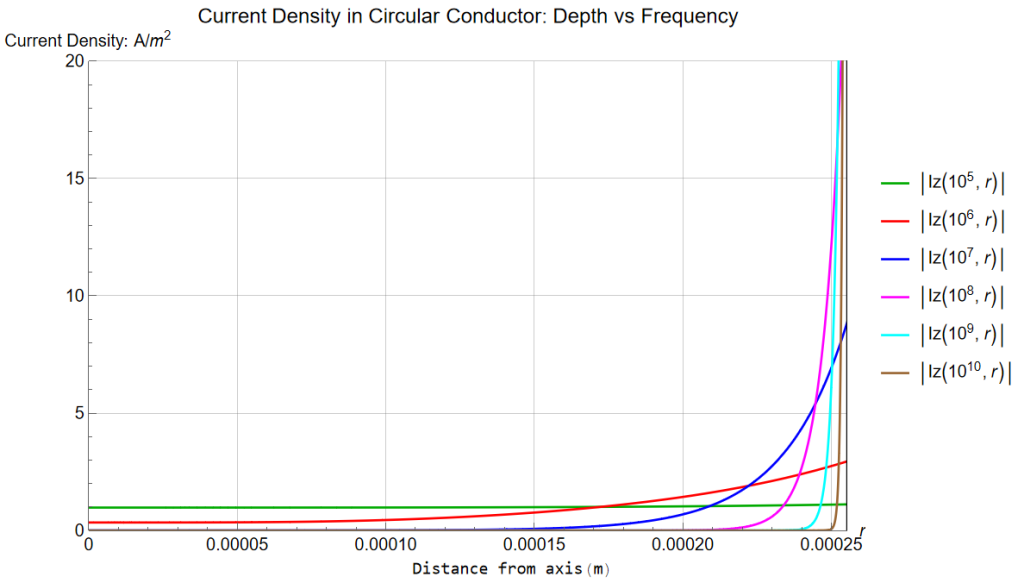
Skin Depth Tubular
In a tubular structure, the defining expression involves Bessel functions. For distance-from-axis d:
![]()
The GRN line represents the normalized uniform density.
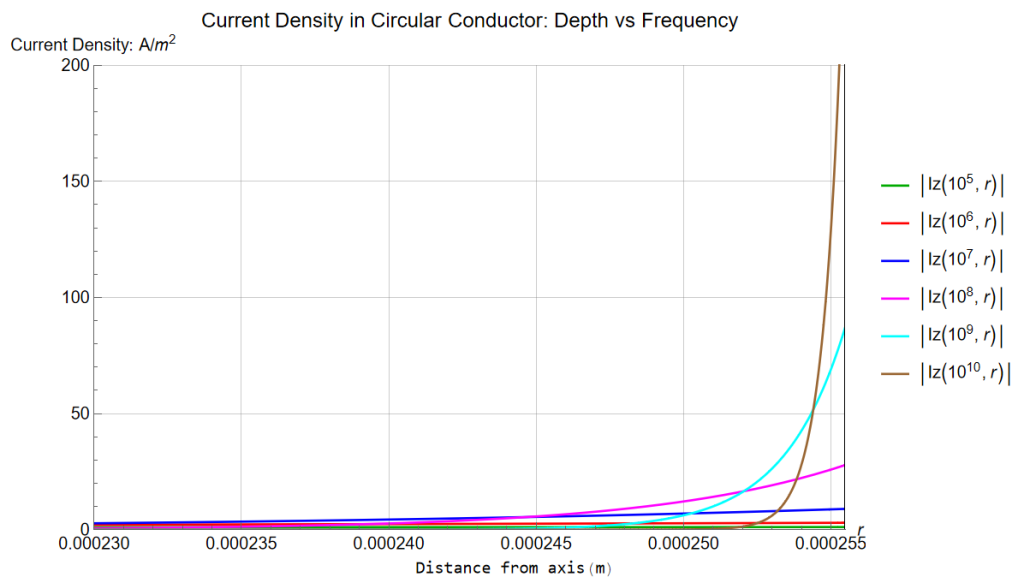
In detail closer to surface … within 25 ![]() m of the surface; I’m ultimately interested in the higher frequencies.
m of the surface; I’m ultimately interested in the higher frequencies.
DC Tubular Inductance: Inductance vs Inner radius geometry
The static DC inductance for a solid conductor has been established; the DC inductance of a tubular structure is defined by geometry:
![Rendered by QuickLaTeX.com \begin{displaymath}\frac{\mu}{\,2\,\pi\,}\,\left[\,\frac{ri^4}{\,\left(\,ro^2\,-\,ri^2\,\right)^2\,}\,\mathit{ln}\left[\frac{ro}{\,ri\,}\right]\,-\,\frac{3\,ri^2\,-\,ro^2}{\,4\,\left(ro^2\,-\,ri^2\,}\,\right)\,\right]\end{displaymath}](https://davemcglone.com/wp-content/ql-cache/quicklatex.com-f2523e38de8cf39d8ee6db5dddc95832_l3.png)

DC Resistance
The DC resistance of a copper conductor is found by using the expression:
![]()
AWG wire charts give a resistance of 84.22 m![]() for #24 wire
for #24 wire

A log scale is more appropriate for examination of effective resistance as the tube gets thinner. From a solid conductor resistance of less than 1/10 ![]() /m, it approaches and exceeds 100
/m, it approaches and exceeds 100![]() when the diameter gets within a few microns of the surface.
when the diameter gets within a few microns of the surface.

But a thickness of 1 ![]() m seems extreme, eh?
m seems extreme, eh?
AC Resistance Solid
The AC resistance for a solid circular conductor may be determined by:
![]()
![]()
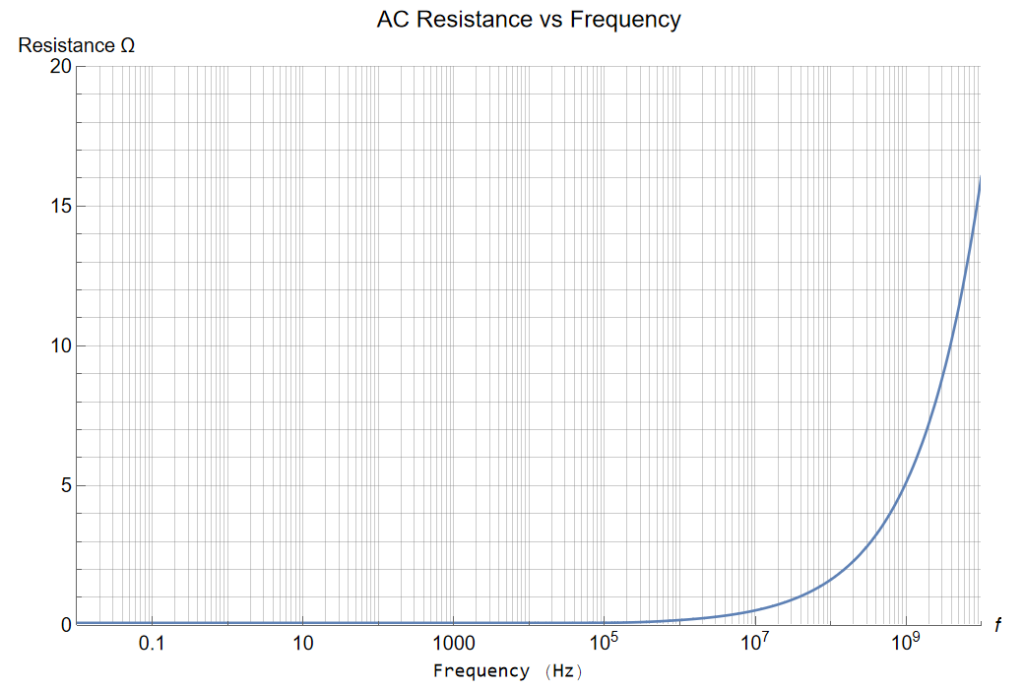
Again, a log scale for the upper regions of the response. The scale ends at 100 GHz. My personal experience worked with frequencies between 200 and 300 GHz. That’s a different world than DC. And this chart is idealistic.

At DC, the resistance is 81.8 m![]() ; at 10 GHz, 16.1
; at 10 GHz, 16.1![]()
AC Resistance Tube
As could be expected, the expression is a bit more complicated for a tubular structure. A lot more actually.
And here is where I ran into trouble …
Define a term ![]() where
where ![]() is the wave propagation constant (
is the wave propagation constant (![]() ):
):
(For a good conductor, ![]() )
)
![]()
The resistance for a tubular structure is given as:
![]()
However, I run into machine precision issues at frequencies above about 1 GHz with thin rings.
Try another approach (Ward & Hohmann)
Just as an aside, this information is useful for measuring conductivity contrasts for subsurface targets; a basic structure would be ellipsoidal … a football with rounded ends.
The radial electric field in a tubular conductor for the inside radius ri > 0 is expressed:
![]()
The resulting DC magnetic field is:
![]()
which results in a magnetic field of
![]()
At frequency, the skin effect needs to be considered; the magnetic field is found from:
![]()
Taking derivatives:
![]()
This leads to the magnetic flux for the tubular structure:
![]()
Since the magnetic flux is zero at the inner radius:
![]()
It’s convenient to define a term ![]()
![]()
The expressions for the fields within the ring are now presented as:
![]()
The impedance is now determined to be:
![]()
From the impedance term, expressions for R and L may be extracted
![Rendered by QuickLaTeX.com \begin{displaymath}\begin{align}\textnormal{R}\,=\,-\mu\,f\,&\left[\,\mathit{j}\,\frac{1}{\,k\,r\,}\,\frac{\,\textnormal{J}_o(kr)\,-\,\textnormal{G}(kr)\,\textnormal{Y}_o(kr)\,}{\textnormal{J}_1(kr)\,-\,\textnormal{G}(k\,ri)\,\textnormal{Y}_1(kr)}\,\right]\\\\\textnormal{L}\,=\,-\frac{\,\mu\,}{\,2\,\pi\,}\,&\left[\,\mathit{j}\,\frac{1}{\,k\,r\,}\,\frac{\,\textnormal{J}_o(kr)\,-\,\textnormal{G}(kr)\,\textnormal{Y}_o(kr)\,}{\textnormal{J}_1(kr)\,-\,\textnormal{G}(k\,ri)\,\textnormal{Y}_1(kr)}\,\right]\end{displaymath}](https://davemcglone.com/wp-content/ql-cache/quicklatex.com-f020b66896181cd4b2a43cb0f1c09458_l3.png)
At low frequency and r1 ![]() 0, the impedance is found to be
0, the impedance is found to be ![]() as expected.
as expected.
Plotting over frequency with ri = 0.1![]() :
:
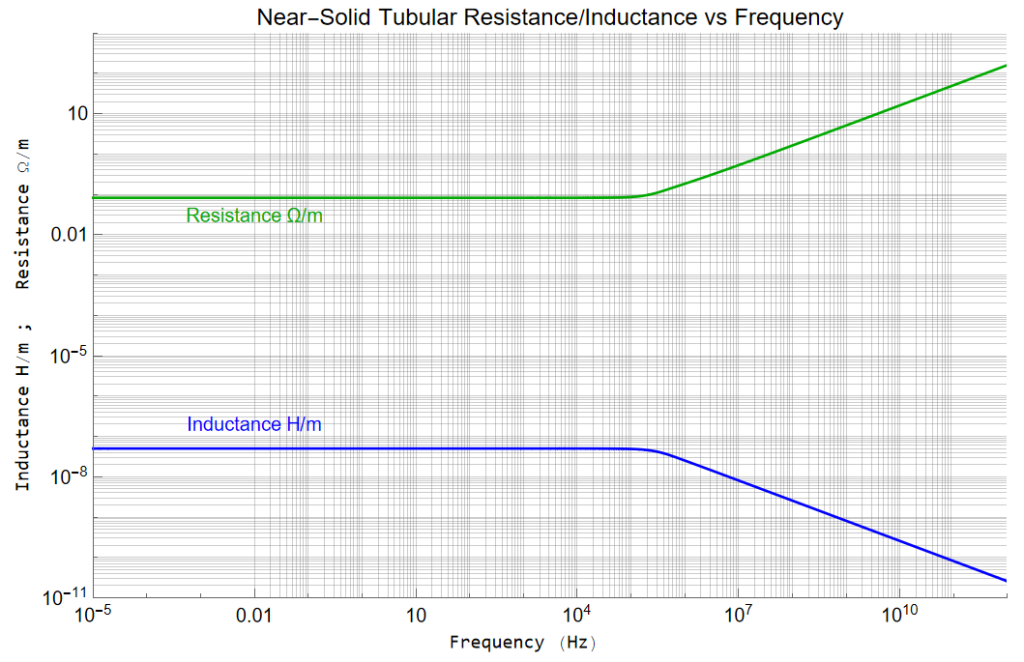
My problem again occurs when the ring thickness becomes very thin at higher frequencies. With a ring thickness of 10![]() m, the Bessel Functions become unstable just below 20 MHz, however, the asymptotes appear equivalent to those of the thicker ring.
m, the Bessel Functions become unstable just below 20 MHz, however, the asymptotes appear equivalent to those of the thicker ring.
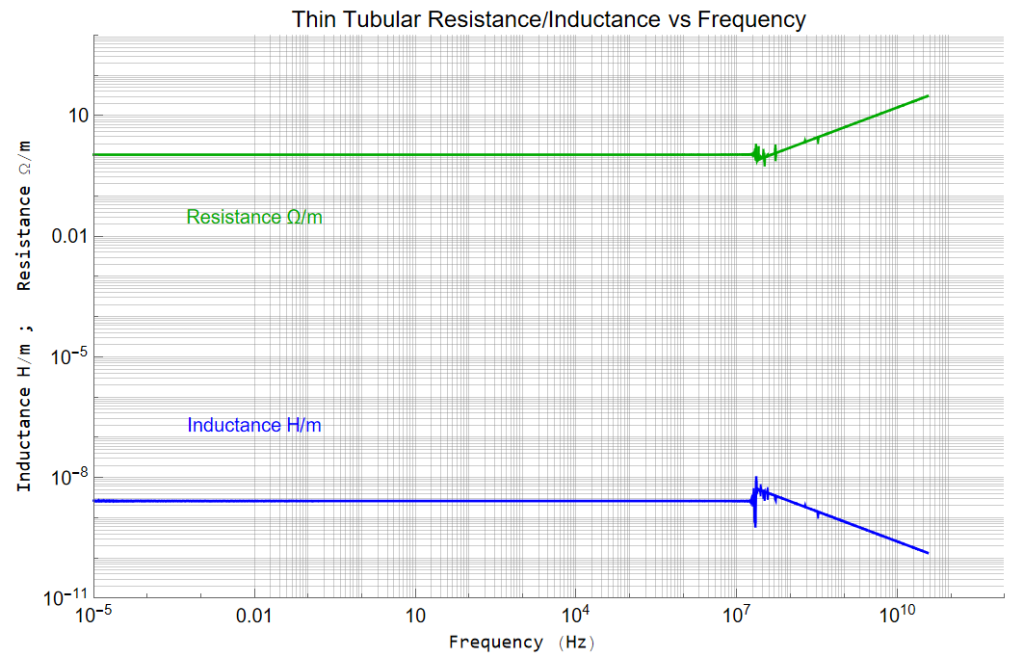
There are alternate methods to overcome this problem – which is apparently due to computer analysis limitations … playing very large numbers against each other to obtain results which are very small numbers … but to get into the weeds any deeper would require incorporating other factors – and that isn’t the intent of this discussion.
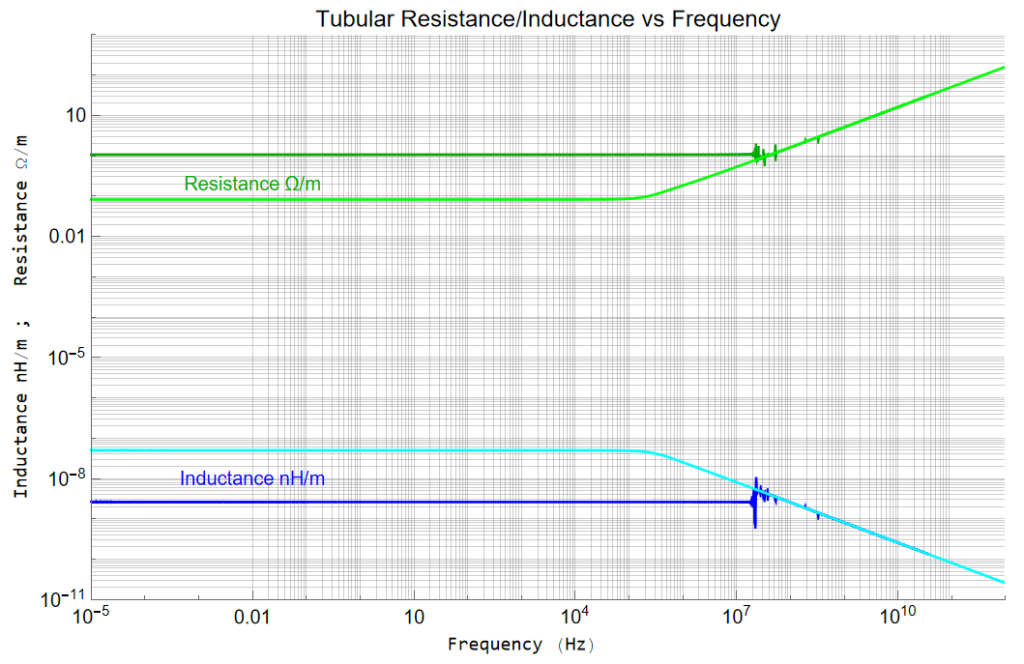
These are the results I’ll work with; the thin conductor issues appear asymptotic to the solid conductor results anyway. It’s too bad the transition occurs in the frequency range of interest.
Comparison of a solid conductor (GRN & CYN) to a very thin (10![]() m) ring (BLU & DkGRN)
m) ring (BLU & DkGRN)
The disruption of the Bessel Functions occurs when the argument
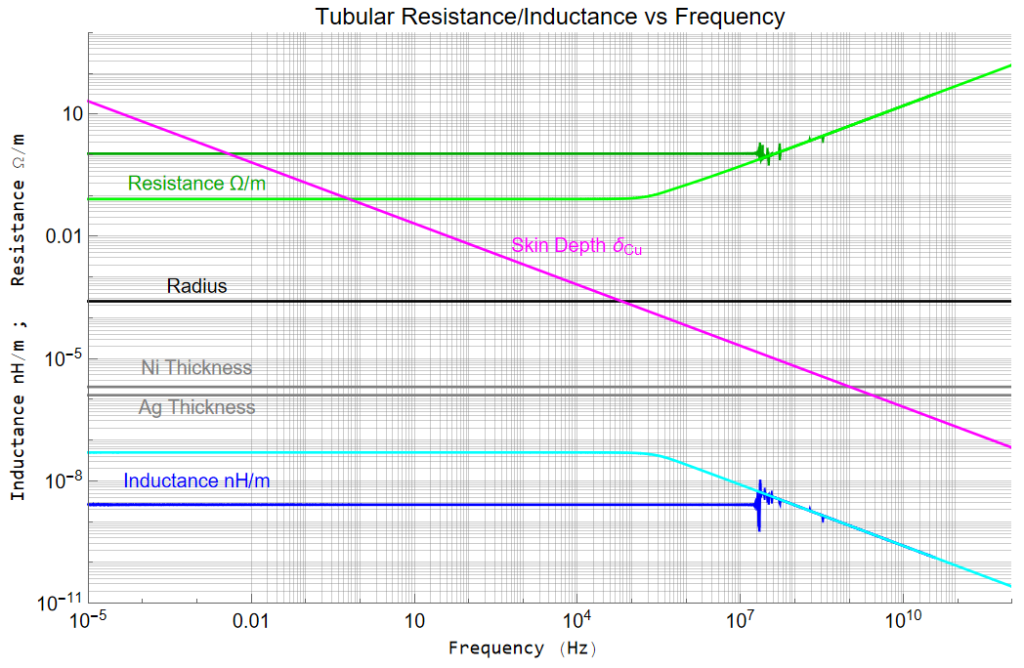
A busy plot Resistance (![]() /m) and Inductance (H/m) with skin Depth as well as the Radius and plating thicknesses of silver and nickel.
/m) and Inductance (H/m) with skin Depth as well as the Radius and plating thicknesses of silver and nickel.
The skin depth is smaller than the radius (511![]() m) at about 70kHz; smaller than nickel plating (2.03
m) at about 70kHz; smaller than nickel plating (2.03![]() m) at 1 GHz; smaller than silver plating (1.27
m) at 1 GHz; smaller than silver plating (1.27![]() m) at 2.5GHz. The Bessel Functions give out at about 20MHz (at a ring thickness of 10
m) at 2.5GHz. The Bessel Functions give out at about 20MHz (at a ring thickness of 10 ![]() m)
m)
The expressions for resistance and inductance are “exact”; I apply them to the silver and nickel metals
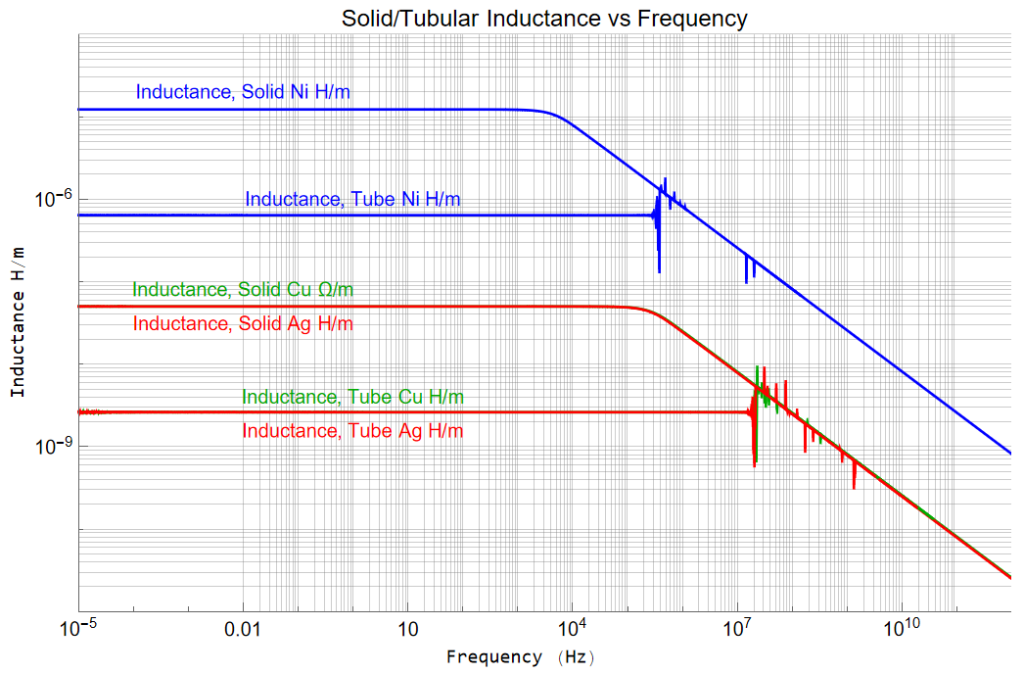
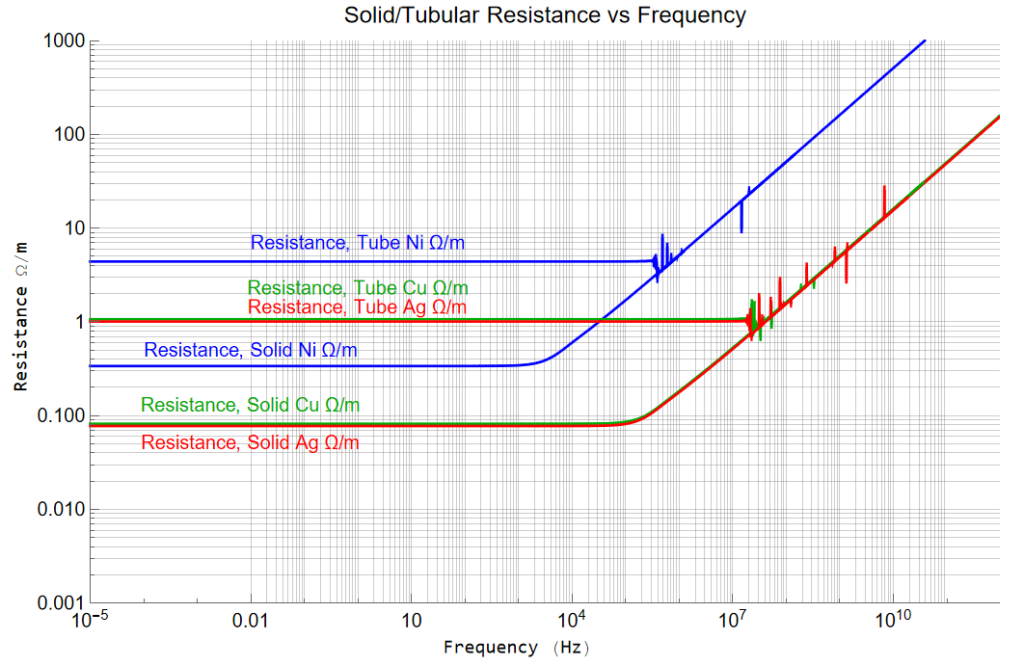
I want to take a detour here and examine the problem with the Bessel terms. Examination of the argument, kr, indicates issues as a function of radius and frequency – as world be expected since the argument’s two terms are related to radius and frequency.
Plotting:
![]()
and plotting over frequency and inner radius:

Adding the attenuation term, Plotting the log of the function, and narrowing the frequency range gives better insight.
For inner radius ![]() :
:

where the BLU regions indicate numerical instability.
Examining this information further, I obtain this plot which indicates an approximate line (RED) of demarcation.
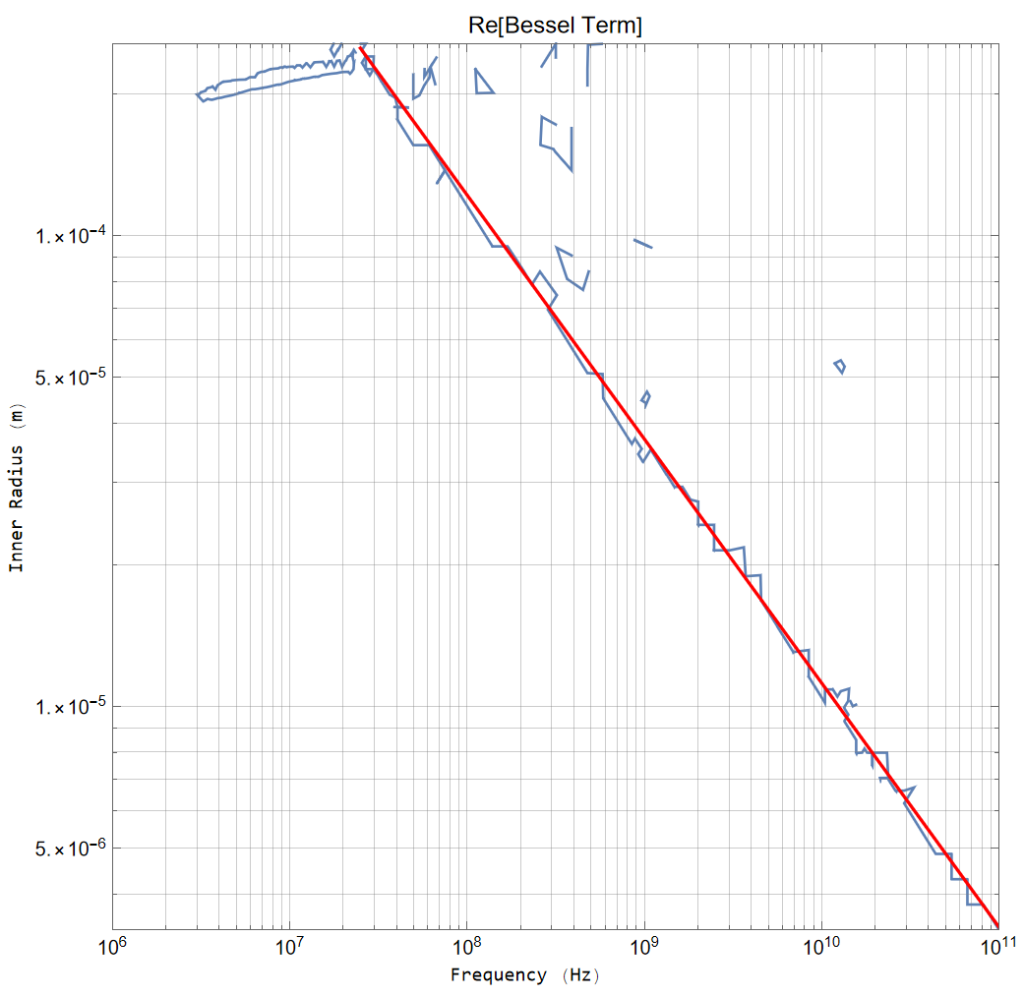
A bit of analysis gives an expression for the demarcation line:
InnerRadius = 2.2705 Frequency(-0.5334)
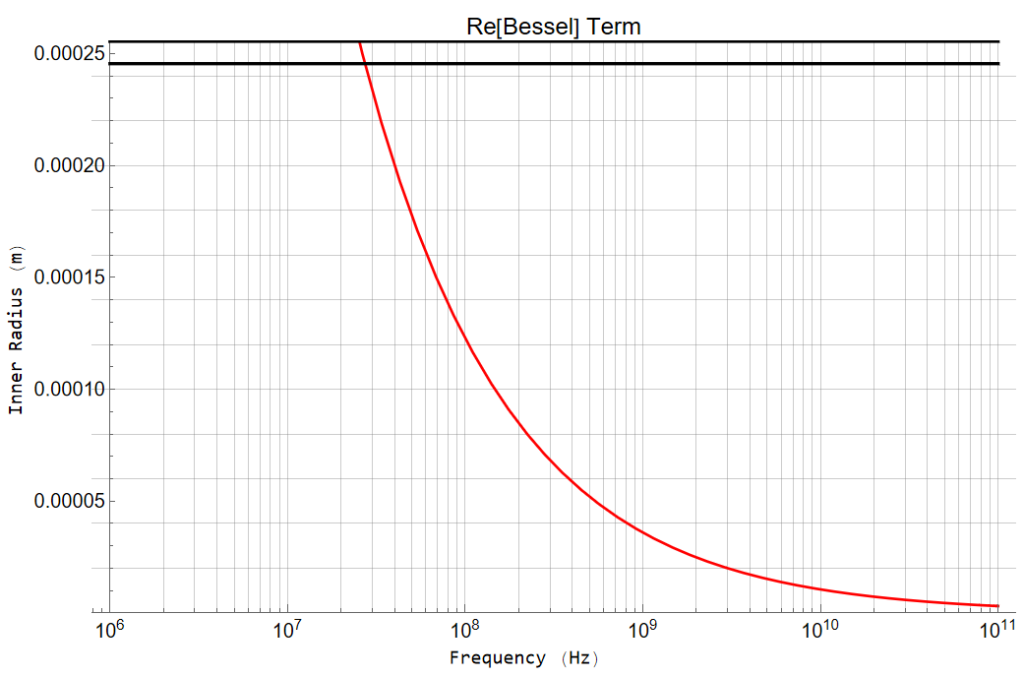
The analysis becomes numerically unstable to the right of the RED line
A lot deeper in the weeds than I originally intended with more to go.
I think this is enough for this post – more in the next section.
