I left Part 3 indicating the Butterworth filter was superior in amplitude response and the Bessel in group delay response. To this point, the analyses have been in the frequency-domain … but measurements are made in the time domain (but may be converted to frequency domain for presentation such as in a spectrum analyzer).
By definition, a sine or cosine function has a mean value of zero and a peak amplitude of 1. Not directly stated is that the peak-to-peak magnitude is 2. This can be a concern when considering the input range of an ADC; a 1V sine wave needs a minimum full-scale range (FSR) ADC input of 2V to be properly quantized without additional processing.
![]()
where ![]() is peak amplitude – assumed unity unless specified, f is frequency in Hz, and
is peak amplitude – assumed unity unless specified, f is frequency in Hz, and ![]() is phase … usually assumed zero.
is phase … usually assumed zero.
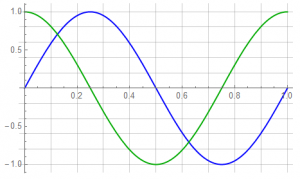
The sine function is in blue; the cosine function in green:
The RMS value of both functions is identical. For a sinusoidal function, the value is:
![]()
It should be noted that by definition, the RMS value of a “DC” signal is the magnitude of that signal. While the RMS magnitude of a 1V sine wave is about 0.707, the RMS magnitude of a 1V DC signal is 1V. This can be an issue when considering ADCs: Are the input limits in RMS units or absolute magnitude? A 2V (more in practice) ADC input is needed for a 1V sine wave; a 1Vrms input is not sufficient.
Analysis is often performed in the Laplace domain (s-domain) rather than time domain; cascaded systems are convolved in time but multiplied in Laplace. The filters discussed in earlier sections were developed in the Laplace domain. The transformation between domains uses the Laplace Transform.
The sine function ![]() becomes:
becomes:
![]()
which is reduced to ![]() for
for ![]() = f = 1 and
= f = 1 and ![]() = 0.
= 0.
Letting various factors go to 0 and 1 often make the math easier to view – but adds confusion for the student entering industry when applying principles to reality.
2nd-order functions are often insufficient in practice; 8th-order systems are often over-kill. For the following discussion, I’ll use the 4th-order filter functions of the previous sections.
As a reminder, these are:

I’ll also use the frequency-normalized Bessel function.
![]()
These have magnitude and group delay responses of:
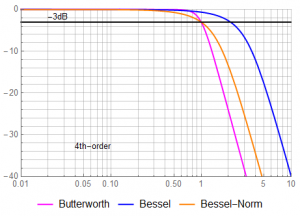
The corner frequency of the 4th-order Bessel is about 2.3 rather than 1
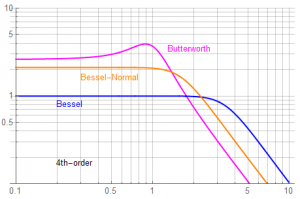
But the cost of frequency-normalization is an increase in delay time and a lowering of the delay time corner (although still at or above the filter corner frequency of 1 ). The applicability of filter function is project dependent.
A step function is used to determine the filter response to an instantaneous change in input. In the Laplace domain, this step function is represented by 1/s. The function to be analyzed is the result of multiplication of the s-domain representations.
![]()
The time-domain response is obtained by taking the inverse Laplace transform of the result:
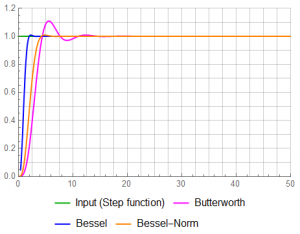
The Butterworth response has significant overshoot …
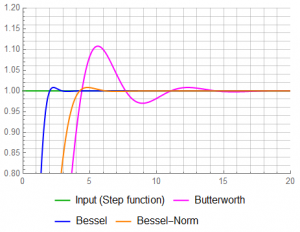
A 12% overshoot may have serious consequences when measuring amplitudes with a multiplexed or sampled system. The Bessel has a small degree of overshoot – about 0.8%. The solution of course is to wait some period of time until the response has settled to steady-state … about 18 units for the Butterworth; about 9 units for the Bessel. The specific figure depends on what constitutes sufficient accuracy for a particular project.
The response within ![]() 5% limits:
5% limits:
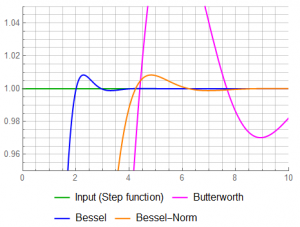
While the step response is informative, it is most common for sine functions to be measured. I want to look at several distinct frequencies. To do so, I use convolution to determine the time response. Admittedly, working in the Laplace domain is a less intensive analysis but it’s good to keep the tools from getting rusty.
Convolution is defined as:
![]()
For functions having value from ![]() to
to ![]() ,
,
![]()
So, while knowing the convolution definition is OK, it’s good to be able to use it …
Define ![]() input function in time
input function in time ![]()
Define ![]() filter function (in the time domain)
filter function (in the time domain)
In this case, I have two filter functions so I define the filter functions ![]() and
and ![]()
Integrate over ![]()
I sure wish I had CAE tools something like Mathematica when I was in school … but then, it’s also good to know how to change your own flat tire even with “24-hour Roadside Assistance”.
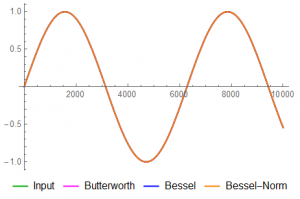
1) f = 0.001 (1 cycle per 17 minutes – call it DC for most situations)
There’s virtually no difference in any response – the filter is about as effective as a piece of wire.
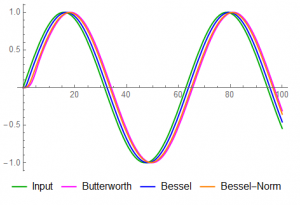
2) f = 0.1 (1 decade below cut-off)
Even a full decade below cut-off, a noticeable phase shift occurs … but the difference between Butterworth and Bessel amplitudes is still pretty insignificant. This will be less so at f = 0.5.
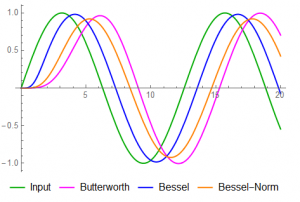
3) f = 0.5 (1/2 cut-off)
Noticeable phase lag both off input and between filter functions. Overshoot is apparent in the Butterworth response. The difference between the Bessel and normalized Bessel becomes obvious as well.
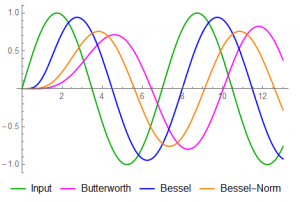
4) f = 0.9 (peak delay in Butterworth)
The delay lag is non-linear across frequencies in the Butterworth response and Butterworth overshoot is still an issue. Because of normalization effects, the normalized Bessel has more attenuation than either the standard Bessel or Butterworth.
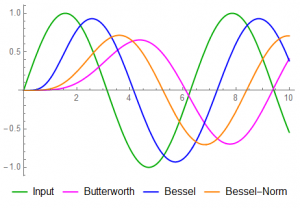
5) f = 1 ( cut-off frequency – peak magnitude of the Butterworth should be 0.707 )
The phase lag is increasing but overshoot is less noticeable.
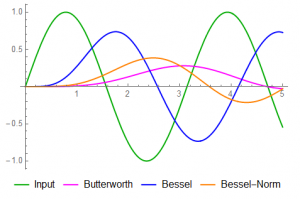
6) f = 2 (twice cut-off)
The standard Bessel corner is about 2.3 and has a magnitude roughly as expected – near -3dB. The Butterworth suffers from undershoot as well as overshoot and its effect appears here. The phase lag between the filters has increased (but becomes relatively constant for frequencies above about 5). The uniform phase lag (linear phase) of the Bessel begins to fail about here.
Although I only show the effects at a single frequency, it is not unusual for a signal to have “bandwidth”; the possibility of a broad band of frequency content. Depending on the application, the group delay effects may be as significant – if not more so – than the magnitude. Usually, accuracy in both is desired … the standard Bessel filter (the “linear-phase” filter) is the better choice for both amplitude and multi-frequency signal integrity.
It’s been my experience that anti-aliasing filters are considered a minor part of a signal measurement system. The 2nd-order Butterworth is common enough and easy enough to design that it is often the “go-to” filter.
The improper selection of filter can contribute quite a bit to the “garbage in” part of GIGO …
Stay tuned for more to come but
That’s good for now …
![]()