The past two articles (Part 1, Part 2) were concerned with the magnitude response of the amplitude-optimized Butterworth filters. The Thomson filter – aka “Bessel” or “linear phase” filter – is optimized for a linear phase response in the passband. This also provides a uniform group delay – all frequencies within the passband are uniformly delayed as they pass through the filter. This is not the case with the Butterworth filter as will be shown later.
As with the Butterworth filter of Part 1, I’ll start with the 2nd-order response. However, the Bessel functions perform better with a minimum order of 3.
The 2nd-order low-pass Bessel function is:
![]()
The magnitude response … with the 2nd-order Butterworth response included for comparison:
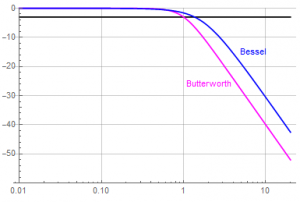
Recall that the magnitude for the Butterworth is optimized for an amplitude of 1 at zero-frequency; the response of the Thomson is optimized for a delay of 1 at zero-frequency … the -3dB frequency is not 1 unless the filter is frequency-normalized.
The coefficients of the Bessel may be modified to achieve a corner frequency of 1. Comparing this normalized response:
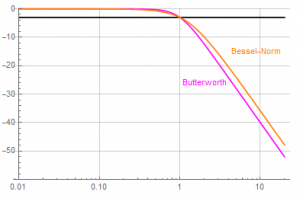
The Bessel roll-off is still slower than that of the Butterworth, but when normalized, the difference is slight. However, the Bessel filter is not utilized for its magnitude response, but its phase response. Things get a bit more interesting when the two phase functions are compared.
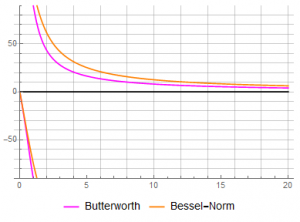
The “linear phase” aspect is difficult to see when plotted on a log scale, but, noting that group delay is the derivative of the phase, the linearity is easier to visualize using the group delay. While the group delay of the normalized Bessel coefficients is still uniform, frequency normalization increases the delay time and lowers frequency of effective linearity.
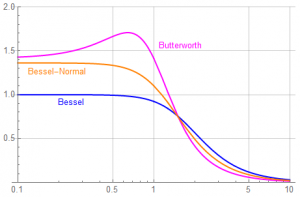
Not only is the Butterworth delay not uniform or monotonic, it is substantially greater than 1 even at zero-frequency. The normalized Bessel delay is also greater than 1 but to lesser degree than the Butterworth.
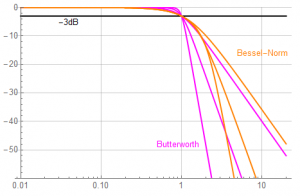
Recall from Part 2 that increasing filter order decreased the requirements for sampling while maintaining amplitude accuracy. I’ll compare the amplitude responses for orders 2, 4, and 8 for each function (including the frequency-normalized Bessel functions):
Four Five more plots and let’s call it a day …
Bessel responses in blue; Butterworth responses in magenta.
Normalized magnitude response; filter order increases from right to left.
In detail from half to twice the corner frequency:
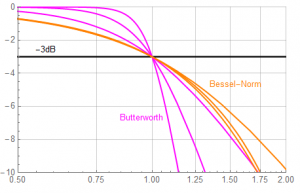
The Butterworth magnitude response is superior to that of the Bessel – but the Bessel isn’t used for its magnitude characteristics.
The Bessel is used for its group delay characteristics … “linear phase”. Recall the derivative of a constant slope is constant. Showing the phase responses directly is not as meaningful as showing the group delay. For this purpose, the Bessel is far superior to the Butterworth. Here the order increases left to right and bottom to top. For a broad signal bandwidth within a decade of the filter corner frequency, the Bessel will offer a uniform delay of the frequency components through the system; the Butterworth delay is frequency-dependent.
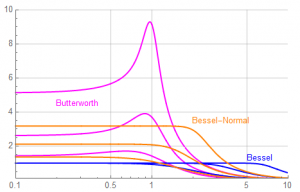
Expand the above plot so that the y-axis constrained to ![]() 1% and note the 4th-order Bessel has uniform delay up to the corner frequency.
1% and note the 4th-order Bessel has uniform delay up to the corner frequency.
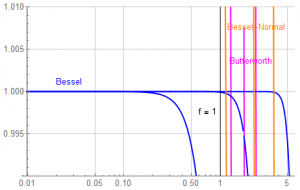
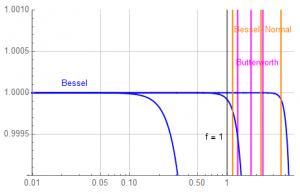
For critical applications, examine the response with the y-axis limits limited to ![]() 0.1% (roughly equivalent to 1 LSB of a 10-bit converter).
0.1% (roughly equivalent to 1 LSB of a 10-bit converter).
The 4th-order Bessel delay remains within ![]() 0.1% beyond the corner frequency.
0.1% beyond the corner frequency.
* * * * * * * * * * * * * *
For reference: Bessel Low-Pass Filter Functions


More to come but
That’s good for now …