A continuous time signal such as that detected by a transducer will likely consist of a summation of sinusoidal functions as well as some degree of noise – which I’ll ignore herein.
Each sinusoidal function will be of the form ![]() . When digitized, the resulting discrete function becomes
. When digitized, the resulting discrete function becomes ![]() where
where ![]() is the sample frequency and
is the sample frequency and ![]() is the integer sample count from 1 to
is the integer sample count from 1 to ![]() (or sometimes
(or sometimes ![]() ).
).
Many methods of data reconstruction intend to reproduce the original input signal such that:
![]()
at least in theory.
![]() is the sample frequency.
is the sample frequency.
This assumes that the original signal was sampled at least twice the highest frequency of the original signal. Frequency components of the original that are higher than the Nyquist limit ![]() /2 are folded back into the signal – seemingly at a different frequency – so that not only is the frequency information lost, but the magnitudes of frequencies within the desired band are distorted and are no longer representative of the desired signal.
/2 are folded back into the signal – seemingly at a different frequency – so that not only is the frequency information lost, but the magnitudes of frequencies within the desired band are distorted and are no longer representative of the desired signal.
Even an ideal reconstruction for sampling above the Nyquist limit is a poor approximation of the original at the lowest sampling frequencies; two methods to obtain the highest quality reconstruction include an approximation of the function by finite time length used as an interpolation function and, most important for my purpose, sampling at a frequency substantially higher than ![]() . The more samples obtained, the better the reconstruction even with less than ideal interpolation functions. Of course, there is an issue of over over-sampling: too much data begins to lessen system efficiency.
. The more samples obtained, the better the reconstruction even with less than ideal interpolation functions. Of course, there is an issue of over over-sampling: too much data begins to lessen system efficiency.
However, my issue here is “Reconstruction of what?” – the answer being “That which is quantized“, i.e., the input signal at the ADC input. Garbage in, garbage out” (GIGO) is as valid with today’s technology as it was when the phrase was first used in 1957: “a flawed input produces a nonsense output.” If “That which is quantized” is flawed, reconstruction will not reproduce the valid signal.
My interest is in assuring a non-flawed input …
A typical but basic signal chain appears in a form similar to:

I assume that the transducer is properly matched to the phenomena to be measured … at least for this discussion. The ADC has been selected for the length of the desired output word (8, 12, and 16 bit are common; lower is almost unheard of, higher is not uncommon), the magnitude range of input signal, and a sampling frequency appropriate for the signal bandwidth. This leaves the block labeled “Amplifier/Filter”. In practice, this block actually includes any pre-quantization signal processing that may be appropriate but gain (amplifier) and filtering (anti-aliasing) are usually necessary at a minimum.
This discussion concerns the filtering aspects.
The transducer defines the “best” possible signal. If the transducer is only capable of 10% accuracy, the best possible reconstruction of the original signal will not improve this 10% limit – interpolation being a “best-guess” estimate. The transducer will also add some degree of noise. Any further processing after the transducer will deteriorate the signal to some degree – possibly by an insignificant amount … but a deterioration nonetheless.
Rarely does a transducer by itself produce a signal ideally matched to an ADC input; amplification is often necessary to match the transducer output magnitude to the necessary ADC input range. If the transducer produces a voltage output, a voltage-gain amplifier will be used. If the transducer produces a current output, a “transimpedance” network is often used to match the voltage input requirement of the ADC.
transimpedance amplifier gain ![]() :
: ![]() where:
where: ![]()
The amplifier – of either sort – will also distort the signal and add noise … and if no other factors intrude, the noise of the transducer and amplifier will have a frequency range well above the Nyquist limit … so some form of “anti-aliasing” filtering is added (I’m discussing the minimum requirements here; other considerations may require additional processing in addition to matching the ADC input with band-limited information.)
In practice, an anti-aliasing filter is often considered a “plug-in and forget” type of network. The signal bandwidth is 500 kHz, so a 500 kHz low-pass filter is put into the circuit. This is often a 2nd-order, Sallen-Key type filter. Well-documented with a “cookbook” type design approach readily available from many sources.
But is this the best approach?
Would I be writing this if it were?
Signals to be measured are in two dimensions: magnitude and time. By Fourier Transform theory, time may be related to frequency. The question of what’s to be measured becomes more complicated: Is the goal to simply measure magnitude accurately or is some sort of “signature analysis” necessary … in which case the integrity of frequency content is also to be maintained? Also to be considered: What acceptable error level constitutes “accuracy”?
The two basic filter responses are the Butterworth, which is optimized for optimal magnitude response, and the Thomson (aka Bessel or “linear phase”), which is optimized for … linear phase response (or more properly, unity group delay).
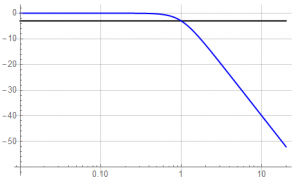
Let’s consider magnitude considerations first. Follows is what is normally thought of when thinking “filter”. A uniform magnitude response with a smooth roll-off above the filter “frequency” – in this example, a frequency of 1.

Frequency units are the common “Hertz” (Hz) in cycles per second or in “rad” – radians per second, a phase angle measure.
![]()
(There is another frequency often encountered, that of space rather than time: designated “k”, the principles are the same but will not be discussed here)
Let’s consider the region near the filter cut-off frequency. In this example, the ideal filter will have a magnitude of 1 throughout the passband – meaning there is no change to the signal magnitude from DC to the cut-off frequency. Ideally, the stopband – frequencies above the cut-off – would result in nothing passing through the filter.
Reality is a bit different.
Consider a 1st-order filter. It has a 0-frequency (DC) magnitude of 1 and a cut-off frequency of 1. By definition, the corner or cut-off frequency is defined as the -3dB point and the asymptotic slope is -20 dB/decade in the stopband. Frequency units aren’t of concern in a normalized representation: the representation is identical for Hz or rad/s.
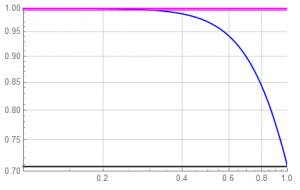
But let’s get rid of the dB scale – information isn’t collected in units of dB – and focus on frequencies in the passband. The y-axis ranges from 0.7 to 1.0.
The magenta line represents the desired amplitude of 1, the black line represents the equivalent of the -3dB point: a magnitude of 0.7071.

Depending on system requirements, there is significant amplitude reduction at frequencies near but below the cut-off.
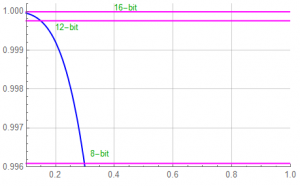
This will have an affect on quantization error. The following shows three magenta lines representing a 1LSB error from the desired magnitude for 8, 12, and 16 bit conversion. Hard to differentiate at this scale. We want to find the amplitude error limits.
Although the passband range goes to the cut-off frequency of 1, the filter has reduced the signal amplitude to more than 1LSB of an 8-bit converter by ![]() = 0.298 (recall that 1LSB of an 8-bit converter represents 1 part of
= 0.298 (recall that 1LSB of an 8-bit converter represents 1 part of ![]() = 1/256 or a bit less than 1/2 percent).
= 1/256 or a bit less than 1/2 percent).

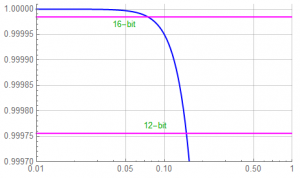
Since 12 and 16 bit converters are prevalent in industry, let’s expand the vertical scale a bit …

The error exceeds 1LSB of a 12-bit converter at ![]() = 0.149 and exceeds 1LSB of a 16-bit converter at
= 0.149 and exceeds 1LSB of a 16-bit converter at ![]() = 0.074.
= 0.074.
This suggests that to maintain amplitude accuracy to greater than ![]() , the filter corner frequency should be greater than 13
, the filter corner frequency should be greater than 13![]() the highest signal frequency … or a higher order filter should be used.
the highest signal frequency … or a higher order filter should be used.

More parts coming, but
That’s good for now …