The Ideal Gas Law & Density
The number density of a atmospheric species is the number of molecules of that species within a unit volume of air. This value has an effect on the absorption of photons based on the relationship:
![]()
Atmospheric pressures are sufficiently low enough that the ideal gas model represents a reasonably suitable approximation and the mixing ratio of atmospheric gases remains relatively constant within the troposphere independent of atmospheric density. The concentration of CO2 is approximately 400 ppmv or 400![]() mol/mol.
mol/mol.
Recall that one form of the Beer-Lambert defines attenuation constant as the product of absorption or scattering cross-section of each particle and the number of particles per volume … particle density.
The particle density varies with temperature, pressure, humidity, and altitude. This is true with scattering particles as well as absorption particles. To get some sort of reasonable estimate of an attenuation factor, I need to get a handle on some atmospheric density characteristics. I am aided in this task by the fairly linear properties of atmospheric parameters within the troposphere![]()
![]() .
.
Density may be determined from the ideal gas relationship ![]() =
= ![]() .
.
![]()
Molar mass is the number of grams per mole of a substance. Multiply the above by the molar mass to convert mole per volume to gram per volume … aka, density:
![]()
where ![]() is pressure,
is pressure, ![]() is the gas constant,
is the gas constant, ![]() is temperature,
is temperature, ![]() is volume, and
is volume, and ![]() is quantity.
is quantity.
Checking units:
![Rendered by QuickLaTeX.com \[ \rho \; \; \Rightarrow \; \; \frac{\; \mathcal{P M} \; }{\mathcal{R T}} \; = \; \frac{\; \mathcal{P} \left(\frac{\text{kg}}{\text{m s}^2} \right) \times \mathcal{M} \left(\frac{\text{g}}{\, \text{mol} \, } \right) \; }{\mathcal{R} \, \left(\frac{\frac{\text{kg m}^2}{\text{s}^2}}{\text{mol K}} \right) \times \mathcal{T} (K) } \; = \; \frac{\mathcal{P M}}{\mathcal{R T}} \, \left(\frac{\text{g}}{\text{m}^3} \right) \qquad \text{as desired and expected} \]](https://davemcglone.com/wp-content/ql-cache/quicklatex.com-72d8740f2fc99d57176936de4e3186d3_l3.png)
To convert to number of molecules per volume, multiply by Avogadro’s Number:
![]()
![]()
![]() = 273.15 K ≡ 0°C temperature
= 273.15 K ≡ 0°C temperature
![]() = 288.15 K = 273.15 K + 15°C base temperature
= 288.15 K = 273.15 K + 15°C base temperature ![]()
![]() = 1.380622 × 10
= 1.380622 × 10![]() J/K Boltzmann constant
J/K Boltzmann constant ![]()
= 1.3806485×10![]() J/K
J/K ![]()
![]() = 9.80665 m/s
= 9.80665 m/s![]() gravitational acceleration =
gravitational acceleration = ![]()
![]() = 8.3144598 (Pa m
= 8.3144598 (Pa m![]() )/(mol K) molar gas constant
)/(mol K) molar gas constant ![]()
= 8.31432 (Pa m![]() )/(mol K)
)/(mol K) ![]()
![]() = 22.41962 × 10
= 22.41962 × 10![]() m
m![]() /mol ideal gas molar volume
/mol ideal gas molar volume ![]()
= 0.022414 m![]() /mol
/mol![]()
![]() = 6.022140857 × 10
= 6.022140857 × 10![]() Avogadro Constant molecules/mol
Avogadro Constant molecules/mol ![]()
= 6.022169 × 10![]() molecules/kmol
molecules/kmol ![]()
![]() = 1 atm ≡ 101325 Pa standard atmosphere pressure
= 1 atm ≡ 101325 Pa standard atmosphere pressure ![]()
![]() = 22.710947× 10
= 22.710947× 10![]() m
m![]() /mol molar volume, ideal gas
/mol molar volume, ideal gas ![]()
USSA: United States Standard Atmosphere (1976)
![]() = molar mass of CO2 (carbon dioxide) ⇒ 44.009 g/mol
= molar mass of CO2 (carbon dioxide) ⇒ 44.009 g/mol
![]() = molar mass of CH4 (methane) ⇒ 16.043 g/mol
= molar mass of CH4 (methane) ⇒ 16.043 g/mol
![]() = molar mass of H2O (water) ⇒ 18.015 g/mol
= molar mass of H2O (water) ⇒ 18.015 g/mol
The measure will be the number of photons (aka “intensity”). That measure will be compared to the number of photons transmitted and from that will be deduced the concentration of a species gas – carbon dioxide in this case (water vapour and methane are also constituent gases of interest). The degree of absorption depends on the density of CO2 molecules within the optical path. Because of the linearity (per USSA), CO2 density is assumed uniform within the region of atmosphere of interest; the nominal concentration of CO2 is assumed to be 400 ppmv of the atmosphere.
Atmosphere – Transmission Media
Estimating the transmission media is not a trivial task. Although the measurement is differential and atmospheric variations null out as common-mode components, the effects of common-mode variations define the compliance range: what are the limits of common-mode signal that need to be considered? In electronic circuits, this issue is quantified as “common-mode rejection” … a topic for a different discussion.
The linear relationship allows me to work out a few basic atmospheric models at sea level and scale as needed.
I begin with the Ideal Gas Model to estimate atmospheric density.
Ideal Gas
The molecular density of air:
![]()
The gas is uniformly mixed, the density of CO2 is 400 ppmv, therefore the molecular density of CO2 is:
![]()
The mass density of CO2:
![]()
Of course, the atmosphere is not really an ideal gas.
Standard Atmosphere
As the name implies, this is the reference atmospheric model![]() . It assumes a clean, dry, uniform gas mixture with a molecular weight of 28.964 kg/mol. The molar mass of dry air is the result of the combination of the following atmospheric constituents
. It assumes a clean, dry, uniform gas mixture with a molecular weight of 28.964 kg/mol. The molar mass of dry air is the result of the combination of the following atmospheric constituents![]() :
:
Constituent gases:

Conditions at sea level:

where the mean molecular weight is defined as:
![]()
with an accepted value (USSA) of 28.9644 kg/kmol (28.9644 g/mol) at sea-level.
Per USSA-1976, the accepted value of the fractional volume of CO2 (314 ppm) suggests:
![]()
However, the later CIPM model (2007) uses 400 ppm as the accepted value of the fractional volume of CO2 giving results:
![]()
The model is based on idealized conditions at sea-level at specific temperature and pressure. Of course, it can be made much more complex … but I’m obtaining reasonably accurate information to define measurement capabilities, not interpreting nuances.
The Standard Atmosphere is the model onto which other factors are related – such as the consideration of temperature, pressure, and humidity as a function of altitude.
Temperature and Pressure
The previous calculations were for sea-level conditions – recall that density is defined as:
![]()
which defines the density dependency on both pressure and temperature – which in turn vary with altitude.
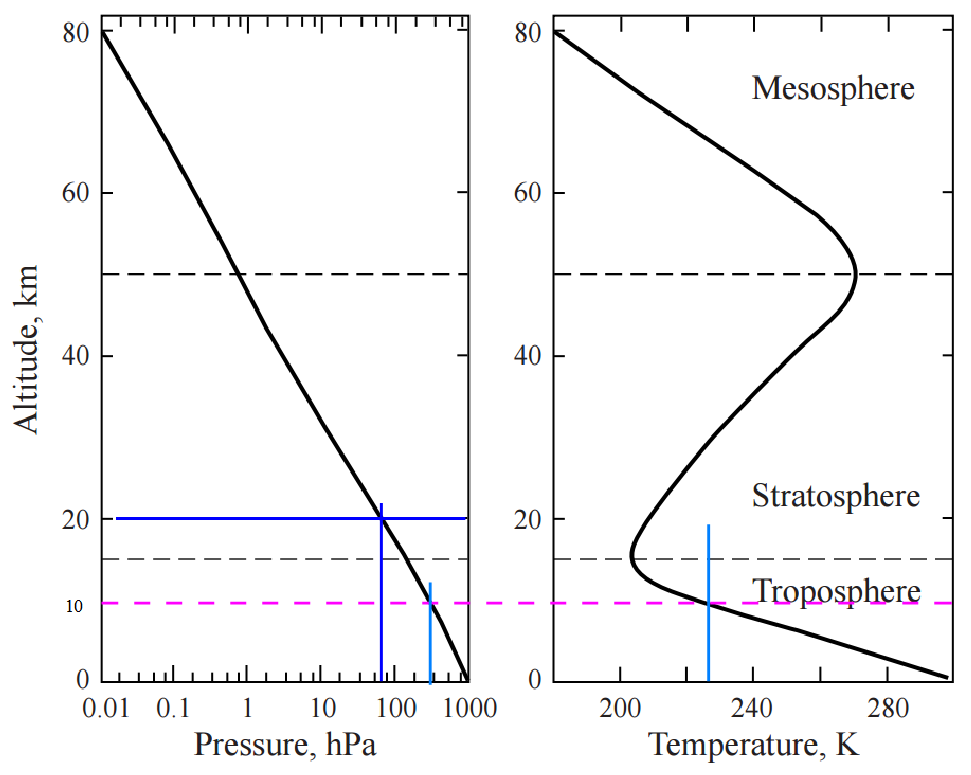
The following charts show the pressure and temperature profiles over the depth of the atmosphere to 80 km. The MAG line represents the 10 km maximum altitude of interest. This is close to the boundary between the troposphere and stratosphere but far enough below that tropospheric (and linear) conditions remain valid enough for estimation purposes.
Temperature
Temperature is considered linear with altitude to 16 km (Level 0) … above the 10 km altitude of interest.
From approximations derived from the above charts:
![]()
A value of -6.5![]() K/m is standard which is equivalent to a drop of about 3.6°F/1000 ft.
K/m is standard which is equivalent to a drop of about 3.6°F/1000 ft.
Temperature vs. altitude in degrees Kelvin (15°C at sea-level):

Pressure
As the altitude increases, the atmospheric pressure (and density) decreases. The correction factor for pressure vs. altitude is given as:
![Rendered by QuickLaTeX.com \[ \text{P} \; = \; \mathcal{P} \, \left( \, 1 \, - \, \frac{\, z \, \Gamma \, }{\mathcal{T}} \, \right)^{\frac{\mathcal{G} \, \mathpzc{m}_{dry}}{\mathcal{R} \, \Gamma}} \]](https://davemcglone.com/wp-content/ql-cache/quicklatex.com-421874655a2a268d92671a3848c2fb2f_l3.png)
where the molar mass of dry air is defined: ![]() = 0.028964 kg/mol and
= 0.028964 kg/mol and ![]() is the temperature coefficient with value of -6.5
is the temperature coefficient with value of -6.5![]() K/m.
K/m.
Note: the exponent term consists of defined physical values and has a value of 5.25588.
NASA’s Glenn Research Center uses a slightly different representation albeit functionally identical:
![Rendered by QuickLaTeX.com \[ \text{P}_{GRC} \; = \; \mathcal{P} \, \left( \, \frac{\, \text{T}_C \, + \, 273.15 \, }{\mathcal{T}} \, \right)^{\frac{\mathcal{G} \, \mathpzc{m}_{dry}}{\mathcal{R} \, \Gamma}} \]](https://davemcglone.com/wp-content/ql-cache/quicklatex.com-2e68cd5ec604385ef371b2d6c8f3d284_l3.png)
The actual pressure is found by multiplying this factor by the sea-level pressure ![]() .
.
The response over altitude:

Humidity
Humidity – water vapour – also has an effect on density. Moist air is actually less dense than dry air. Consider that humidity is water vapour, not liquid water. A given volume of air has a certain number of molecules. Density is mass per volume. Dry air – a molecular mix mostly of nitrogen (N2) and oxygen (O2) – has a molecular weight of 28.96 g/mol. H2O has a molecular weight of 2 hydrogen and 1 oxygen – 18.05 g/mol. Assuming a more or less fixed number of molecules in a given volume (about 10.2![]() per m
per m![]() ), the lighter water vapour molecule displaces the heavier N2 or O2 molecule … the higher the humidity, the lower the density (the effect is a minor one though).
), the lighter water vapour molecule displaces the heavier N2 or O2 molecule … the higher the humidity, the lower the density (the effect is a minor one though).
But that doesn’t explain to me why the hot humid air of Tidewater Virginia (or Florida) weighs down on me so much more so than the hot dry air of Death Valley in July … which I much prefer. China Lake or Edwards anyone? Tucson: “Thank God we’re not in Phoenix where it gets hot!“
Density is adjusted for humidity by the following mixing formula for linear systems:
![]()
Or in a more concise form:
![]()
where rH is relative humidity (as decimal) and ![]() is the saturation pressure.
is the saturation pressure.
The formal definition of atmospheric density with water vapour is presented by Picard (CIPM-2007)![]() :
:
![]()
where ![]() is a compressibility factor,
is a compressibility factor, ![]() is the mole fraction of water vapour,
is the mole fraction of water vapour, ![]() is the molar mass of water in g/mol, and
is the molar mass of water in g/mol, and ![]() is the molar mass of dry air in g/mol.
is the molar mass of dry air in g/mol.
The molar mass of water ![]() is a known value:
is a known value: ![]()
The water vapour fraction ![]() is defined:
is defined: ![]()
Term ![]() is an “enhancement” factor:
is an “enhancement” factor: ![]()
where: α = 1.00062 β = 3.14 10![]() γ = 5.6 10
γ = 5.6 10![]()
It is not uncommon to let ![]() = 1 … as I’m going to.
= 1 … as I’m going to.

Vapour Pressure
The term “![]() ” represents the saturation vapour pressure as defined in Picard
” represents the saturation vapour pressure as defined in Picard![]() :
:
![]()
where T is degrees K and:
a = 1.2378847 × 10![]()
b = -1.9121216 × 10![]()
c = 33.93711047
d = -6.3431645 × 10![]()
At 15°C, ![]() = 6.6114
= 6.6114
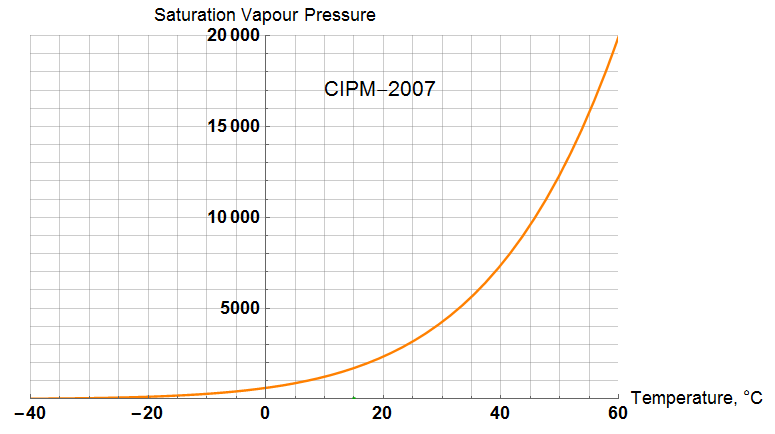
An alternative algorithm for determining the saturation pressure was developed and tested long ago – in the days of FORTRAN and VAX 11/780s – at NOAA’s Environmental Research Lab![]() . I suppose the algorithm’s been refined since … but since the Standard Atmosphere is basically the same as in 1976 (up to 11 km at least), I suspect this algorithm is the same – except perhaps re-compiled in a different programming language (and since I demonstrate an adequate approximation, I didn’t investigate further).
. I suppose the algorithm’s been refined since … but since the Standard Atmosphere is basically the same as in 1976 (up to 11 km at least), I suspect this algorithm is the same – except perhaps re-compiled in a different programming language (and since I demonstrate an adequate approximation, I didn’t investigate further).
![]()
where:
![]()
The coefficients are:
T![]() = °C
= °C
![]() = 6.1078
= 6.1078
co = 0.99999683
c1 = -0.90826951 × 10![]()
c2 = 0.78736169 × 10![]()
c3 = -0.61117958 × 10![]()
c4 = 0.43884187 × 10![]()
c5 = -0.29883885 × 10![]()
c6 = 0.21874425 × 10![]()
c7 = -0.17892321 × 10![]()
c8 = 0.11112018 × 10![]()
c9 = -0.30994571 × 10![]()
The resulting response over temperature:

The difference between the two algorithms is likely not significant (note the scales: the difference at 60°C is 20 Pa of 20 kPa).

A “ballpark” expression for saturation pressure is:
![]()
with a response over temperature of:
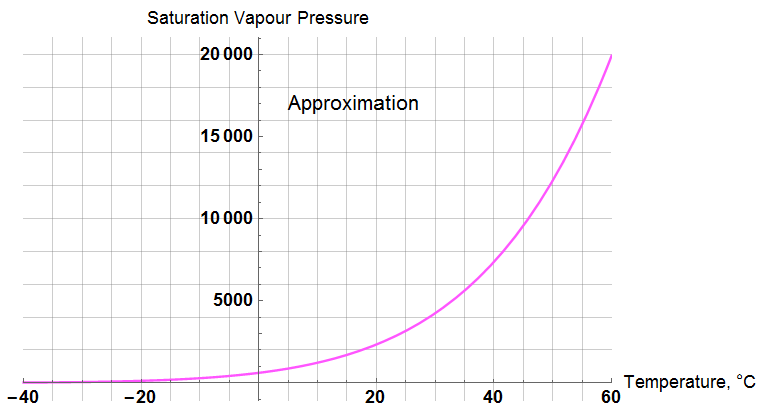
Comparing the three algorithms:

I don’t see much point in carrying through with either of the “exact” expressions; the uncertainty of reality far exceeds these minor differences.
Compressibility Factor ![]()
Having determined the saturation pressure and enhancement factor ![]() , the value of x
, the value of x![]() is defined and may be used to determine the compressibility factor
is defined and may be used to determine the compressibility factor ![]() .
.
Factor ![]() is found from a bit of an ugly expression:
is found from a bit of an ugly expression:
![]()
where T is degrees K, t is degrees C, and:
ao = 1.58123 10![]()
a1 = -2.9331 10![]()
a2 = 1.1043 10![]()
bo = 5.707 10![]()
b1 = -2.051 10![]()
co = 1.9898 10![]()
ca = -2.376 10![]()
d = 1.83 10![]()
e = -0.765 10![]()
All that … and setting ![]() = 1 is not unreasonable – note the z-axis values.
= 1 is not unreasonable – note the z-axis values.


Close enough to “1” for my purposes … but I like to assure myself of that assumption with the full expression.
Dry Air Molar Mass and CO2 Concentration
Of particular interest for my purposes is the effect on atmospheric density of changes in CO2 concentration. Recall that density is expressed:
![]()
The dry air molar mass ![]() is defined by the summation of the constituent gases. The molar mass of dry air as a function of CO2 concentration may be expressed:
is defined by the summation of the constituent gases. The molar mass of dry air as a function of CO2 concentration may be expressed:
![]()
The molar mass varies as a function of CO2 concentration:

This is a very small effect – and examining the effect on atmospheric density over temperature shows no discernible change:

This is an insignificant change – and not feasibly measurable as such under the expected field conditions. However, density is not the intended measurand and I can reasonably drop the modification of the molar mass from my working expression.
Humidity
Humidity modifies density as was demonstrated with the saturation vapour pressure. Examining the effect on overall atmospheric density:


The change is not very significant except at the higher temperatures and relative humidity – neither of which is likely at higher altitudes.
Atmospheric Density
And now I finally have enough information to adequately define the atmospheric density as a function of altitude, temperature, vapour pressure, compressibility, and CO2 concentration … but when it comes down to it, altitude and temperature have the largest effect, humidity has a minor effect, but the effects of compressibility and CO2 concentration may be neglected.

So the model for atmospheric density may now be expressed:
![Rendered by QuickLaTeX.com \begin{displaymath} \begin{align} \rho_a \; &= \; \frac{ \mathcal{P} \; \text{m}_a }{ \, \mathcal{R} \, \left(273.15 \, + \, \text{T}_{\text{K}} \right)\, } \, \left[ \, 1 \, - \, \left(\text{rH} \, \frac{\, psv \, }{\mathcal{P}}\right) \, \left( \, 1 \, - \, \frac{ \, \mathpcz{m}_v \, }{\mathpcz{m}_a} \, \right) \, \right] \\ \\ &\Rightarrow \; \frac{ \mathcal{P} \; \text{m}_a }{ \, \mathcal{R} \, \left(273.15 \, + \, \text{T}_{\text{K}} \right)\, } \, \left[ \, 1 \, - \, \frac{\, \mathcal{P}_{sat} \, }{\mathcal{P}} \, \left( \, 1 \, - \, \frac{ \, \mathpcz{m}_v \, }{\mathpcz{m}_a} \, \right) \, \right] \quad \text{\larger where } \text{\larger{ rH = }} \dfrac{\mathcal{P}_{sat}}{psv} \end{align} \end{displaymath}](https://davemcglone.com/wp-content/ql-cache/quicklatex.com-938e31a95dc40476fe77baee91a7720e_l3.png)
Substituting terms and plotting over altitude, temperature, and relative humidity:

The two surfaces represent min (upper: rH = 0) and max (lower: rH = 1) relative humidity. The difference due to humidity is significant enough to be discernible at the extremes, but not significant enough to cause changes to necessary instrument design parameters.
Follows is the surface plot for density at 100% humidity. As expected, the lowest density occurs at the highest altitude and temperature … though it is far more likely to be -40°C (or lower) at 10 km that 60°C.
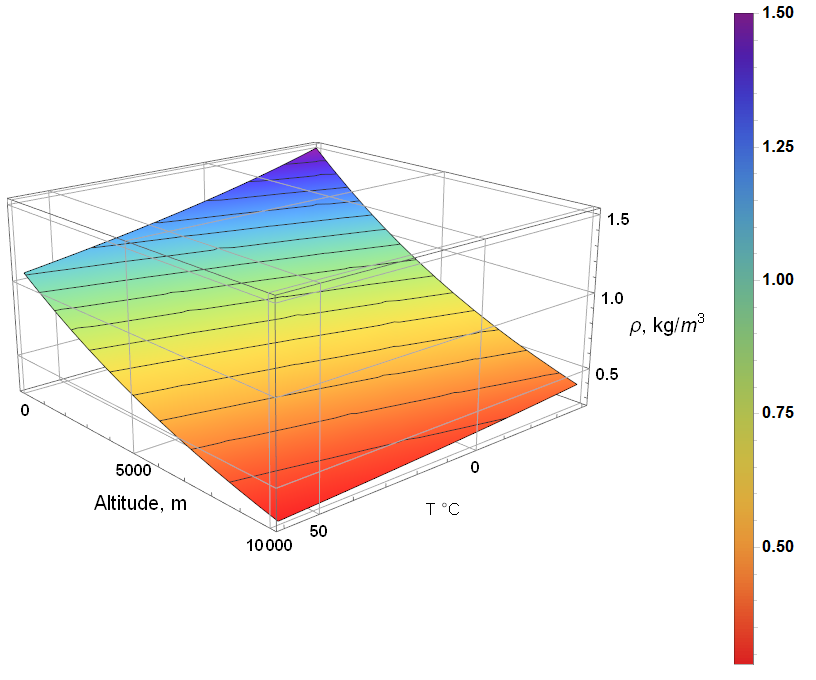
The two following density surface plots of altitude and temperature indicate the modelled variations for max and min relative humidity.
Dry (rH = 0):

Given the standard temperature of 288.15 K (15°C) and a temperature coefficient of 0.0065 °C/m, the standard temperature at 10 km would be -50°C.
Wet (rH = 1):
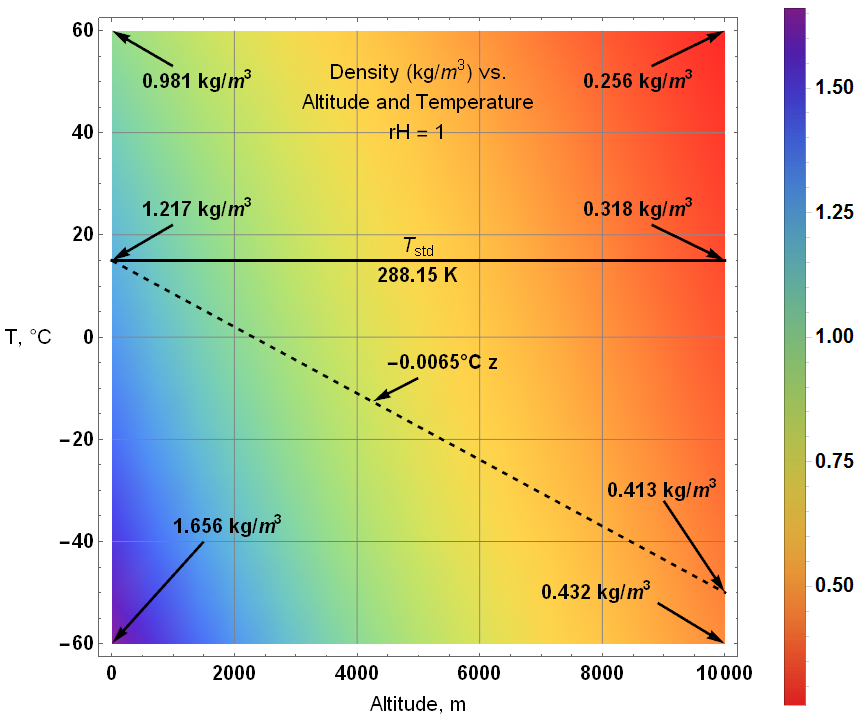
The only significant difference between wet and dry is within the upper regions.
The model density profile follows the dashed line.
If I were to simply take the CO2 concentration to be a fraction of atmospheric number density, I obtain the following result for CO2 number density:

Altitude: 0 → 10,000 m CO2 concentration: 350 → 450 ppmv
The change is slight but noticeable at any altitude as illustrated with a colorized contour plot.
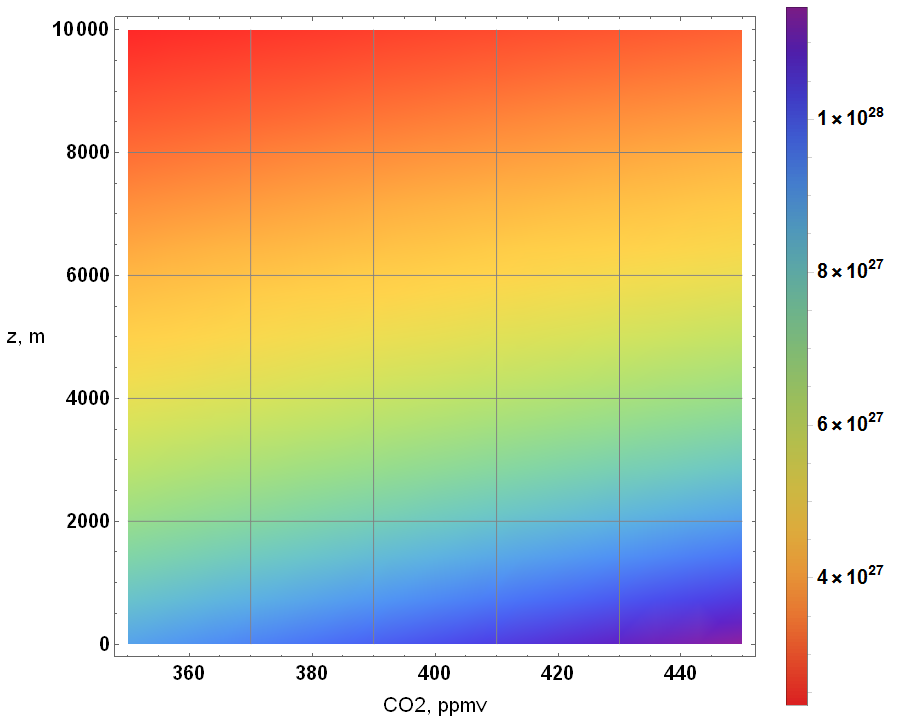
Unfortunately, the above approximation doesn’t account for the molar mass change due to the relationship between O2 and CO2. By allowing the modification of the dry air (standard atmosphere) molar mass due to a change in CO2 levels, I obtain the following.

The change in number density as a function of altitude is obvious but the shift due solely to a change in concentration is not.
The difference is present as shown below …
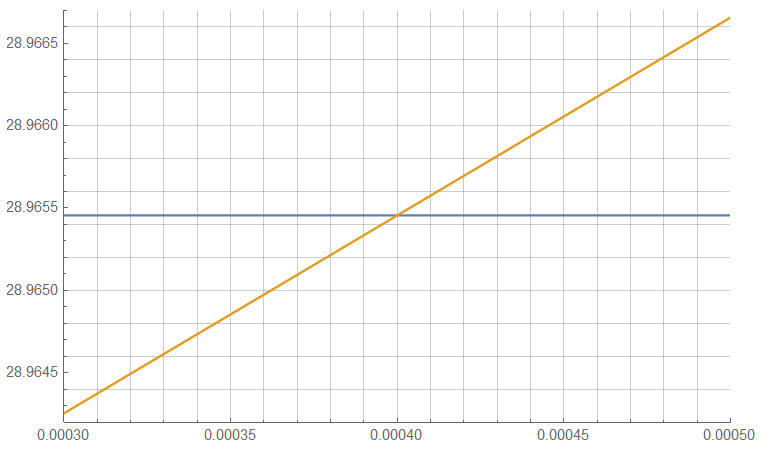
But is so slight as to be lost in the uncertainty present in the field – is the resulting change in density due to a change in CO2, a change in pressure, a change in temperature … or a change in some other factor?
Simply relating intensity to CO2 concentration isn’t sufficient … this is one reason a differential measurement method will be developed.
Well. That’s a fair overview of atmospheric density – particularly as I was only intending to find limits for instrument design.
Part 4 – Differential Beam
Part 6 – Reflection
That’s good for now.
![]()