So, what to do, what to do …
Let’s consider a system built on a printed circuit board (PCB). The most common PCB material is FR41 which has a corner frequency of around 1 GHz or so. The actual bandwidth of FR4 varies depending on specific material, thickness, trace width, # layers, and other such. Polyimide is a far superior material for building precision or high-speed networks; the -3dB bandwidth of polyimide is about 7-8 GHz. The dielectric constant (which is often not constant) of FR4 is about 4.4 – 4.6; that of polyimide about 4.0-4.2. I have not considered skin depth in this analysis nor do I consider transmission line effects.
1 Note that FR4 is not a specific material, it is a material standard. In general, it is a fibreglass/epoxy composite with a dash of fire-retardant material, often a bromine compound. “FR” stands for “Fire Retardant”.
For purposes of this discussion, the material will be considered a bulk low-pass RC network; the basic concept applies to the distributed model as well. In these examples, the primary clock frequency is 1/10 the platform bandwidth – a 1 GHz clock on a 10 GHz platform.
The 1st-order response of a system with 10 GHz corner frequency appears as:
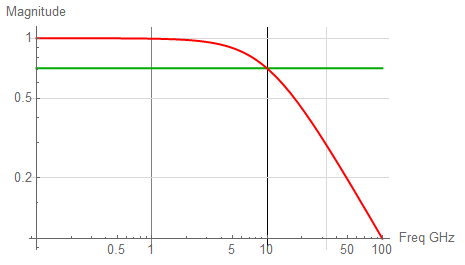
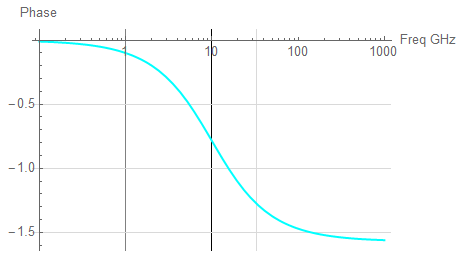
Any signal applied to this PCB will be subject to attenuation due to the board itself. A Fourier Series is inherently a discretized function so to find the amplitude components of each component frequency, I’ll use the following expression for each harmonic of interest.
![Rendered by QuickLaTeX.com \begin{displaymath}A \; = \; \text{Abs} \, \left[ \, \frac{1}{\, 1 \, + \, \jmath \, \frac{f}{\, f_o \,} \, } \, \right]\end{displaymath}](https://davemcglone.com/wp-content/ql-cache/quicklatex.com-36e5a9d5a6467aa172ca2050a66e45cc_l3.png)
where
I set up a calculation routine.
First, I’ll define a frequency list based on the number of harmonic frequencies desired:
![]()
The list is scaled; n = 1 represents a frequency of 1 GHz.
Then I define a table of amplitudes based on this frequency list:
![Rendered by QuickLaTeX.com \begin{displaymath}\text{amp} \; = \; \text{Table}\left[ \, \text{Abs}\left[ \, \frac{1.}{\, 1 \, + \, \jmath \, \frac{\, \text{freqList[[i]]} \, }{f_o} \, \right] \, }, \, \text{\{i, 1, freqList \}} \, \right]\end{displaymath}](https://davemcglone.com/wp-content/ql-cache/quicklatex.com-c30f536d912699ad86a286f60cb0ac6b_l3.png)
and plot the amplitudes of each component.
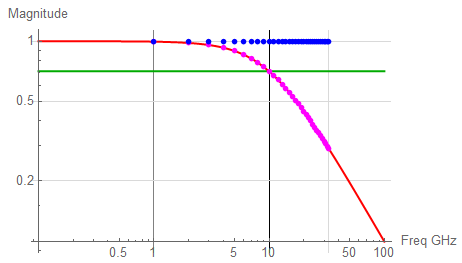
The magnitude plot with 33 harmonic frequencies indicated appears as:
Log plots are handy for visualization over wide frequency ranges; the linear plot appears as:
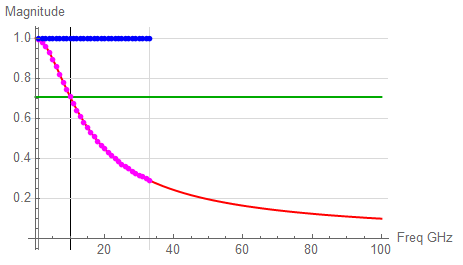
In both plots (the same data; differing presentation), the RED trace represents the continuous time response, the BLU dots represent the Fourier frequencies with no attenuation; the MAG dots represent the attenuated coefficients, the GRN trace highlights the “-3dB” amplitude.
In the time domain, I compare the unattenuated series (BLU) to the attenuated series (RED), each with the same 33 frequencies. I’m ignoring the Gibbs Phenomena.

Even with 33 frequency components, a decrease in rise time is noticeable.
To approximate a square or pulse wave, the inclusion of several harmonics is necessary (although switching circuits may be driven by single-frequency sine waves – is a “squarewave” truly necessary?). It has been suggested that at least the 3rd, preferably the 5th, harmonics are sufficient to adequately represent the desired waveform. Waveforms of the primary, 3rd, and 5th are shown:
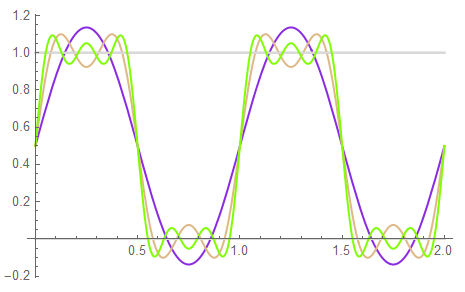
Perhaps limiting the harmonic content to 3 or 5 >is< sufficient …
Consider what may be extremes: 101 harmonics … or the highest frequency component being 101 GHz. Not that FR4 or even polyimide PCBs would come close to adequately passing 101 GHz signals …
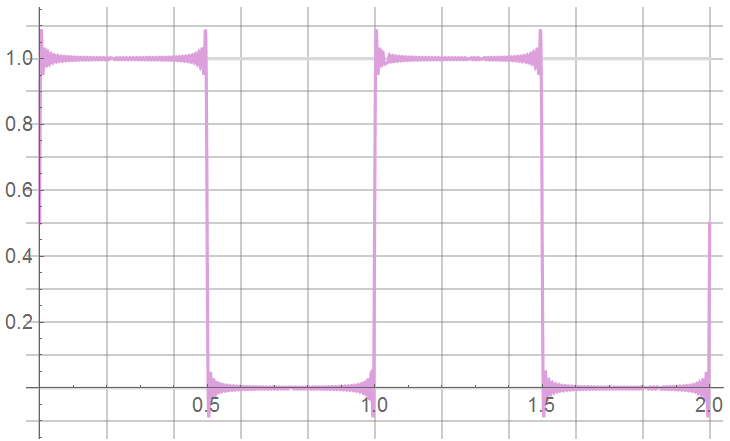
It should be obvious that “closeness” to the ideal waveform increases as the number of included harmonics increases (hence the ideal summation to “infinity”)
But since “infinity” doesn’t exist in the engineering world, a large enough number to adequately approximate infinity is necessary – “large enough” being ultimately limited by the finite bandwidth of the system configuration.
So what defines “large enough”? System requirements of course … but it’s useful to quantify limitations. The difference between 33 and 101 terms appears insignificant – especially when not attenuated:
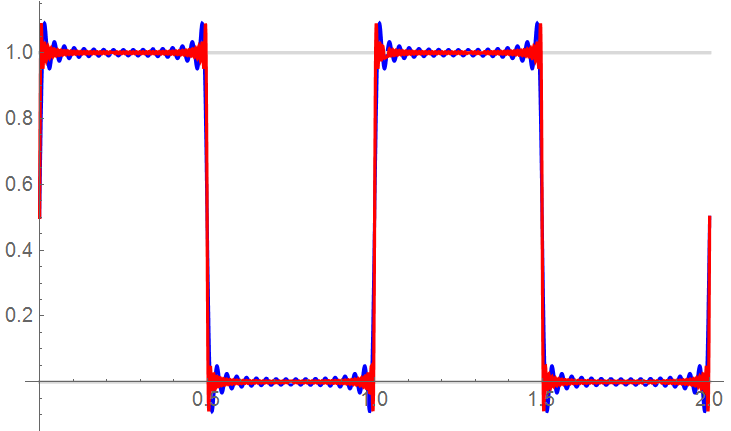
But even 33 terms may require an unreasonable system bandwidth (33 GHz for a 1 GHz primary frequency).
Follows is a plot of a sequence of unattenuated waveforms whose only difference is the number of terms – harmonics – included in the Fourier Series. The time scale is shortened to focus on the rise time. The scale is normalized; the time scale ranges between 0.9 and 1.1x with the ideal transition time occurring at 1.00. Only every 4th-term is included for clarity. Note that the primary frequency (PUR) has a rise time greater than 10% of the pulse period.
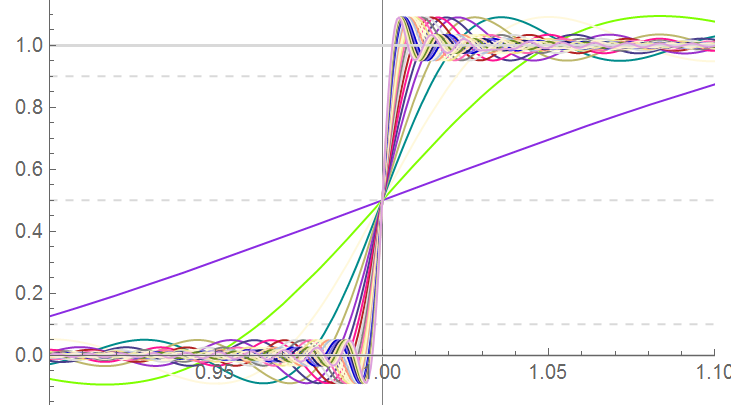
There’s a problem here but I’ll defer that discussion until the next section.
That’s good for now
