Sampling
In the world of measuring physical macro events, a signal is a continuous variation over time. Variation of what may be a topic of separate discussion but in most cases, it’s a variation of magnitude … of something: temperature, pressure, length, intensity, etc.
An ideal sample is a measure of that magnitude at some instantaneous point of time. The sample process is periodic if each time interval between samples is identical over the measurement period. The sample frequency is the inverse of the sample interval where “interval” is in seconds; “frequency” is in Hertz (Hz) … which used to be known as “cycles per second” (cps). The use of Hz over cps was formalized in 1960 and cps fell out of favour sometime by the 1970s.
According to NIST, the second was defined in 1967 as “the duration of 9,192,631,770 periods of the radiation corresponding to the transition between the two hyperfine levels of the ground state of the caesium-133 atom.“
And here I’d been defining a second as the interval between ticks on a clock … 🙂
The sampling theory states that a continuous signal may be reconstructed from discrete data only if the original signal contains no frequencies above ½ the sample rate. In my world, this is known as the Nyquist limit; I understand that it’s called the Shannon theorem in other worlds.
If samples of a signal are collected at sufficiently small intervals, the signal can be reconstructed from those samples. Along about 1928 or so, Henry Nyquist of Bell Labs determined that in order for reconstruction to be possible, the sampling rate needed to be a minimum of twice the maximum signal frequency … with the assumption that the signal content is zero above that frequency (“brickwall” cut-off) – that is, a uniform passband allowing magnitudes at all frequencies up to the Nyquist limit, then a sharp cutoff which allows no frequency content above that limit. Implied but not stated is a uniform phase response (a Butterworth filter phase response is neither uniform nor monotonic).
Impulse Function
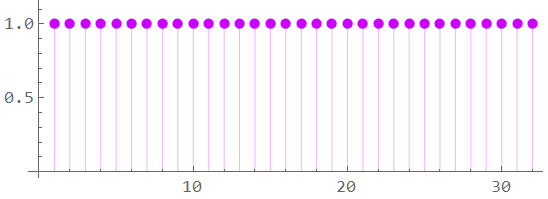
An ideal periodic impulse function consists of a sequence of impulse – or delta (![]() ) – functions at integer multiples of period T.
) – functions at integer multiples of period T.
It may be defined mathematically as:
![]()
and appears as:

As shown, each impulse has infinitely small width (“delta” ![]() ) with magnitude of 1 at each sample time, and a magnitude of zero outside of sample times. When applied to a continuous signal, the result is a sequence of points representing the instantaneous amplitude of the signal as it is at every sample time.
) with magnitude of 1 at each sample time, and a magnitude of zero outside of sample times. When applied to a continuous signal, the result is a sequence of points representing the instantaneous amplitude of the signal as it is at every sample time.
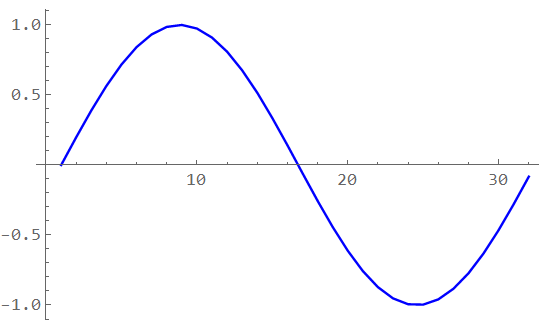
For a given signal such as a sine wave:

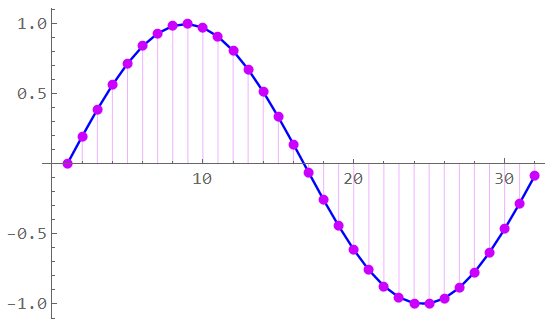
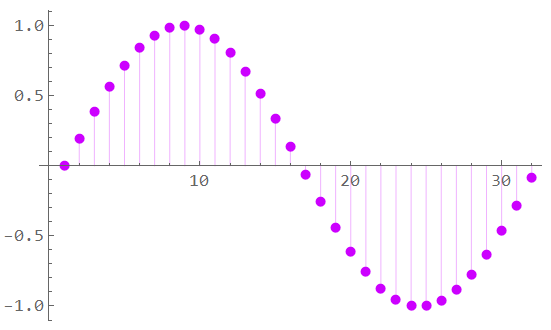
The sampled signal is multiplied by this impulse sequence resulting in a sequence of sample values corresponding to the magnitude of the signal at each nT.

wherein the sequence of samples to be quantized appears as:

Sampling is a modulation process; it generates new frequencies at multiples of the sampling frequency. The multiplication of two time-domain signals – the impulse steam and the measured signal – results in the convolution in the related frequency domains. The signal spectrum is mirrored to the location of each impulse. The positive and negative frequencies are the upper and lower sidebands – the process is equivalent to amplitude modulation.
One of the basic assumptions is a “brickwall” termination of frequency content above the Nyquist limit. Well, that’s not going to happen – if nothing else, noise bandwidth needs to be considered … hence the need for anti-aliasing filters in most situations. When considering such factors, the Nyquist limit is ½ the sample frequency. The highest signal frequency – the bandwidth if defined from DC – in theory must be no greater than the Nyquist limit; in practice, it should be less … maybe much less. This is often if not usually a criteria for the design of the anti-aliasing filter.
Filter Issues
While I don’t care to get into details of filter selection and design here, a bit of filter discussion is necessary. In addition to the magnitude and phase response, the step response should be considered – sample/hold networks, multiplexed inputs – as should group delay – how long does it take the filter to pass the signal? I’ll note that a Butterworth filter will have uniform passband magnitude response, but it does not have uniform phase response and suffers from “ringing” in response to a step input. A Thomson (aka “Bessel” or “linear phase”) filter has a uniform magnitude response and linear phase response – and no ringing – but slower roll-off than the Butterworth. This difference may or may not be important (a measurement is 2-dimensional: time and magnitude. The Butterworth filter is optimized for magnitude response; the Thomson is optimized for time response)
The Chebyshev I filter is often suggested due to its sharper roll-off but has (designable) ripple in the passband. The inverse Chebyshev (aka Chebyshev II) would be the better choice but has ripple in the stopband. An elliptical filter has a very sharp roll-off for a given order but has (controllable with design complexity) ripple in both pass and stopbands.
Which one is best? The Butterworth is almost always the de facto choice – it’s the type of filter thought of when a generic filter is discussed … but is often not the best choice. The Bessel is often the better choice but is a bit more complex to design (although the circuit topology may be the same as for the Butterworth).
Actually, the Bessel isn’t any more difficult to design but in introductory filter design classes, it is the Butterworth that is most often used as an example. There are also a number of “cookbook” approaches to Butterworth design – particularly the Sallen-Key version. A familiarity factor is often the basis for filter selection. I once worked with a project in which a Bessel was necessary (for uniform group delay) but a Butterworth was mandated “because it required less engineer time to design”.
The best way to describe the functions is that the Butterworth has optimized passband flatness, the Thomson has optimized group delay and step response, and the Chebyshev has optimized roll-off.
You need to know your specific project requirements and restrictions …
Aliasing
“Aliasing” occurs if the sample frequency is too low – that is, when the signal has significant frequency components of greater than ½ the sample frequency. This effect “mirrors” signal components of frequencies above the Nyquist limit back into the frequency band below the Nyquist limit – causing distortion in the reconstructed signal. There is also a phase shift involved. This effect may be best illustrated in the frequency domain.
Frequencies above Nyquist get “folded back” or “mirrored” down into the signal band. This distorts the intended signal; the digital word representing the measurement is no longer valid and is now meaningless. If that frequency above Nyquist has desired information, it is lost as well … and it means the sample rate is too low for the measurement desired.
Consider a signal with bandwidth represented by:

This is the manner that “bandwidth” is usually considered: Positive frequencies with rolloff to near-zero beginning at some “corner” frequency. However, the mathematical representation includes “negative” frequencies – a mirrored image about zero frequency if you will.
In the full frequency-domain representation, this signal appears as:

The sampling process is one of modulation where the sample frequency is mixed with the signal frequency. When the sample rate is sufficiently greater than the signal frequency as shown above, there is no interference between sample periods. For each sample point (of period T = 1/fs), a periodic representation of the signal is formed such that the output appears as:

… with the signal bandwidth in BLU, the sample frequencies indicated as “fs”, and the Nyquist limit in RED.
As shown above, there is no aliasing; the signal frequency content has fallen to effectively zero at frequencies below Nyquist. However, if the sample period is too short (or the signal frequency too high) as in the figure below, the signal frequencies extend beyond Nyquist and the overlap indicates aliased information.
These signals don’t really overlap as separate entities as implied by the figure; they add or subtract from each other in a manner in which the original information is lost and the signal is not recoverable. The digital information is invalid.

There is overlap between sample periods: some of the energy of one period appears in another; this manifests itself as an error. The degree to which the error is significant depends on the accuracy required. Aliasing with an amplitude of -90 dB will not be significant if the lowest resolvable signal is at -70 dB; aliasing with an amplitude of -60 dB will be.
Consider a sample frequency of 2 MHz and a filter corner at the Nyquist limit of 1 MHz. White noise is being filtered. If the filter is an 4th-order Butterworth, the noise-equivalent-bandwidth (NEB) is 1.03 and the noise amplitude will be down -12 dB at 1.4 MHz. If the low-frequency magnitude of noise is 1 mV (60 dB below a 1V signal), the effect of aliasing will result in a 3% increase of noise at 600 kHz. If the filter were only 2nd-order, the increase in noise would be almost 10% – this being an “artificial” artifact in the signal band.
Assuming no aliasing, the original signal may be recovered from the sampled impulse stream by low-pass filtering the signal with a filter with a cut-off frequency at Nyquist. Because of the modulation, it is feasible to recover the same information with a bandpass filter set to an appropriate multiple of the Nyquist frequency. Unfortunately, most analog filters of the type required are difficult or even impractical to build. This solution applies to the sampled impulse stream … which has not been quantized in magnitude. (This signal may be analyzed in the z-domain; discrete time, continuous magnitude). Digital filtering techniques may be useful when applied to the quantized information. It is not possible to use digital filters on analog signals (“Why don’t we put a IIR filter before the ADC?“)
Although signal content may be controlled, noise is often a wide-band phenomenon. Increasing the sample frequency to eliminate noise aliasing is often not realistic; sufficient filtering adds time delay and expense.
Perhaps the anti-aliasing filter can be neglected. The resulting digital word will represent the signal “as it is” (keeping in mind it likely still needs some form of pre-quantization signal conditioning – even if simply basic gain and/or![]() level shifting to match the input requirements of the ADC. Any change in signal is immediately passed on to the ADC. No concerns about magnitude or phase distortion … unless aliasing occurs.
level shifting to match the input requirements of the ADC. Any change in signal is immediately passed on to the ADC. No concerns about magnitude or phase distortion … unless aliasing occurs.
This leads to at least one issue rarely considered: power supply coupling. Although DC power supply rejection ratios (PSRR) may be very good, they are subject to roll-off in the same manner as opamp gain. Any noise on the supply lines – including ground (“ground” is not a constant) – may be injected into the signal. This may be high frequency noise (> 1 kHz) and it will show up when measuring small signals.
That’s good for now.

Part 6
Part 8
1“and/or”: A no-no expression for contracts. But this isn’t a contract.