The previous section related the inherent “quantization error” to the signal-to-noise ratio – here I discuss “noise” as it appears when part of the input signal. I don’t delve into different coding techniques, scaling, or bipolar representations. Just a straight-forward and basic “this goes in, this comes out“.
A directly scaled 1:1 3-bit ADC is useful for illustration.
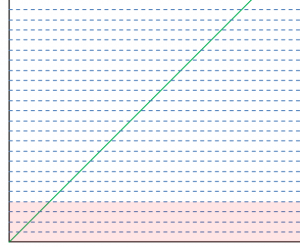
A 3-bit ADC has 2![]() counts or 8 counts. The input voltage will range from 0 → 7 for the purpose of using whole numbers: the output from an input voltage of 1 is 001; the output from an input voltage of 7 is 111. Each count represents an increment of 1 LSB, where 1 LSB is equivalent to the minimum resolution of the converter. For this illustration, 1 LSB is equivalent to 1V. The count for this 3-bit converter is 8 LSB. The plot is gridded at ½-bit intervals.
counts or 8 counts. The input voltage will range from 0 → 7 for the purpose of using whole numbers: the output from an input voltage of 1 is 001; the output from an input voltage of 7 is 111. Each count represents an increment of 1 LSB, where 1 LSB is equivalent to the minimum resolution of the converter. For this illustration, 1 LSB is equivalent to 1V. The count for this 3-bit converter is 8 LSB. The plot is gridded at ½-bit intervals.
Ideal mapping appears as:
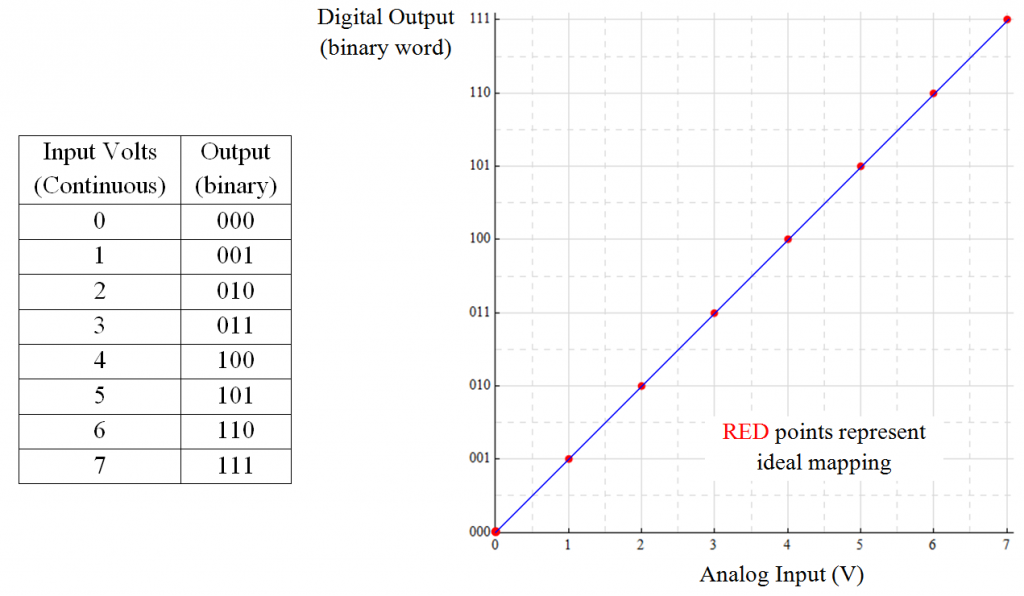
Each integer analog input value has a direct correspondence to the 3-bit digital representation of that number. The number to the far right of the digital word represents the “least-significant bit” (LSB). This defines the minimum resolution; since I’m using integer numbers here, 1 LSB is equivalent to analog value 1. The number to the left is the “most-significant bit” (MSB).
In this form of mapping, the transition between digital words occurs as each integer analog value is reached: the output is 000 for all input values up to 1.0; 001 for values between 1 and 2, 010 for values between 2 and 3 … and so forth. Values above 7 saturate the converter.
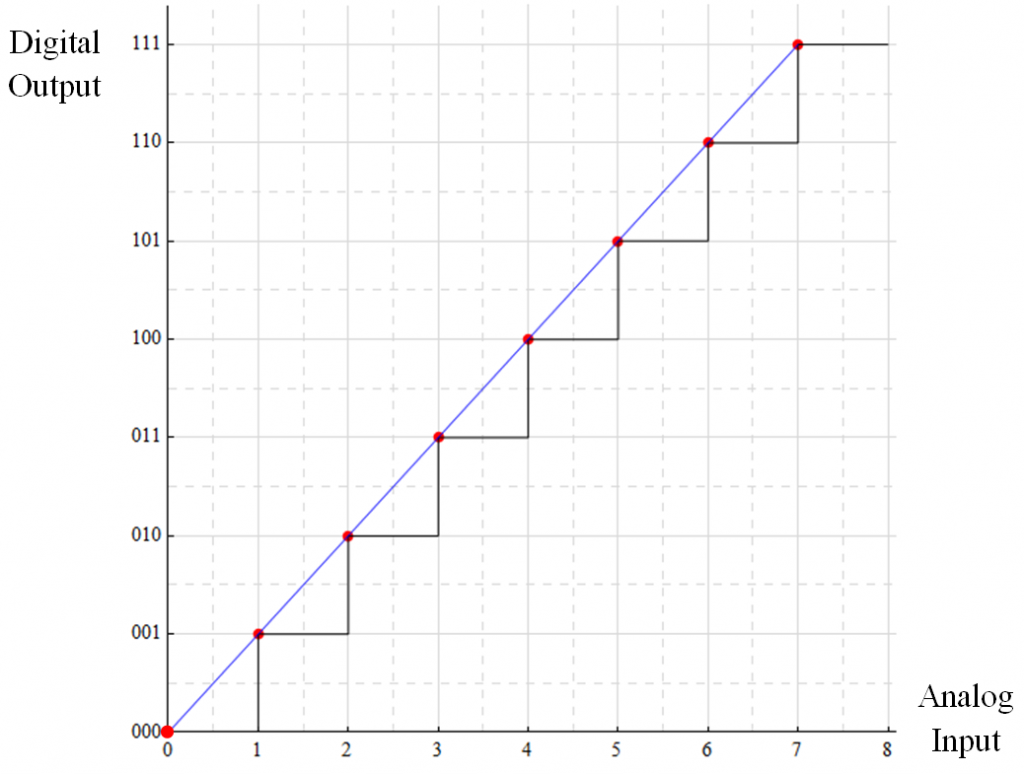
This mapping doesn’t really work well; a preferred mapping is for the transitions to occur at the mid-point. An input value of 1.7 is closer to a value of 2 than 1 and should be represented as such.
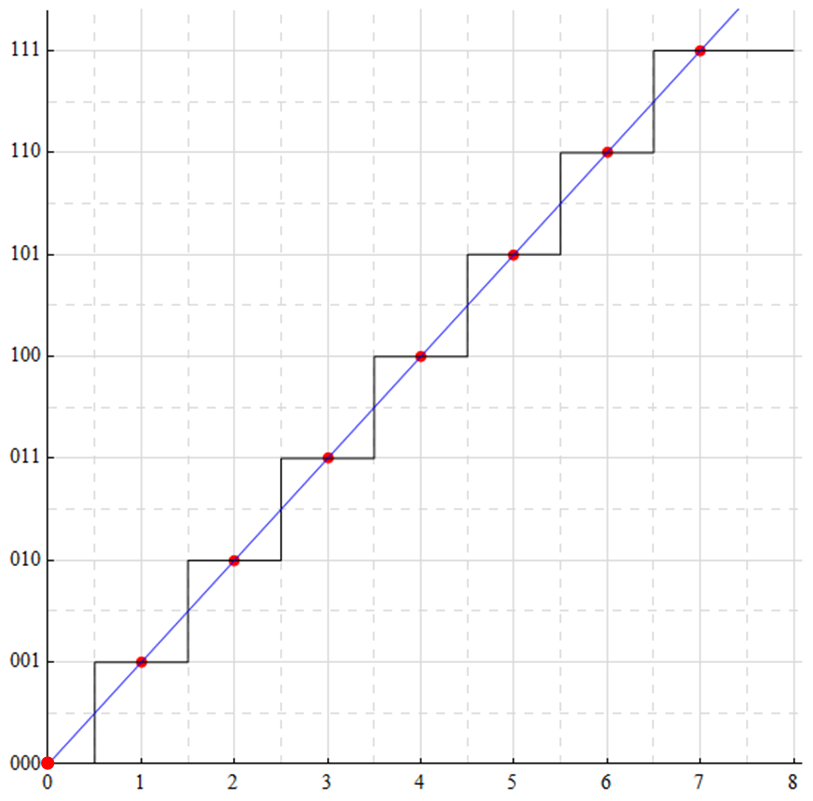
Now the mapping has shifted such that any analog value within ±½-bit of an integer value is represented by that integer. This represents the same “rounding” done in arithmetic.
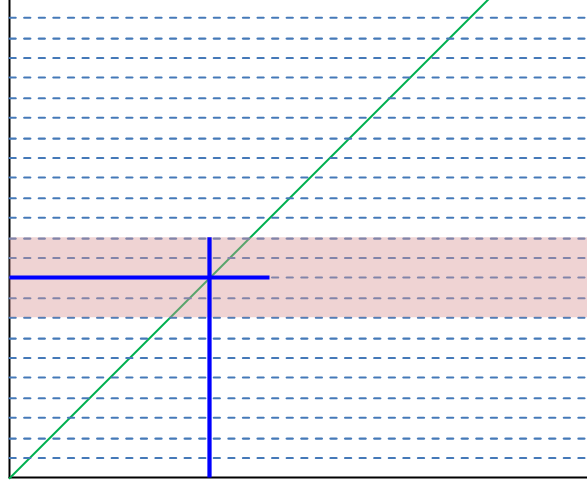
The following shows the transition points. There is “dead” area (GRY) below ½LSB (000) and above ½MSB (111). The analog input range for the constant digital word 100 (PNK) is shown in PUR.

All analog input values between 3.5 and 4.5 are represented by the same digital word: 100. Any information contained within the difference of 3.5+ and 4.5– is lost and can not be accurately recovered from the digital word (and if this is an issue, the converter resolution should be greater).
Errors are most often considered to have a Gaussian (or normal) probability distribution. The following represents a normalized “bell curve”. The mean value (often designated μ) is zero, the standard deviation (often designated σ) is 1. This plot shows the response over a range of ±3σ. In the ideal case, this accounts for 99.73% of all occurrences. Looking closely at the extremes, the values have not reached 0 (and mathematically, they never do). A range of ±3σ is sometimes not sufficient; extending it just a squeek to ±3.3σ now encloses 99.90 of all occurrences. Such a “pure” distribution never occurs in practice; using a scalar of 3 or 3.3 to estimates the probable extremes is a matter of circumstance and preference.
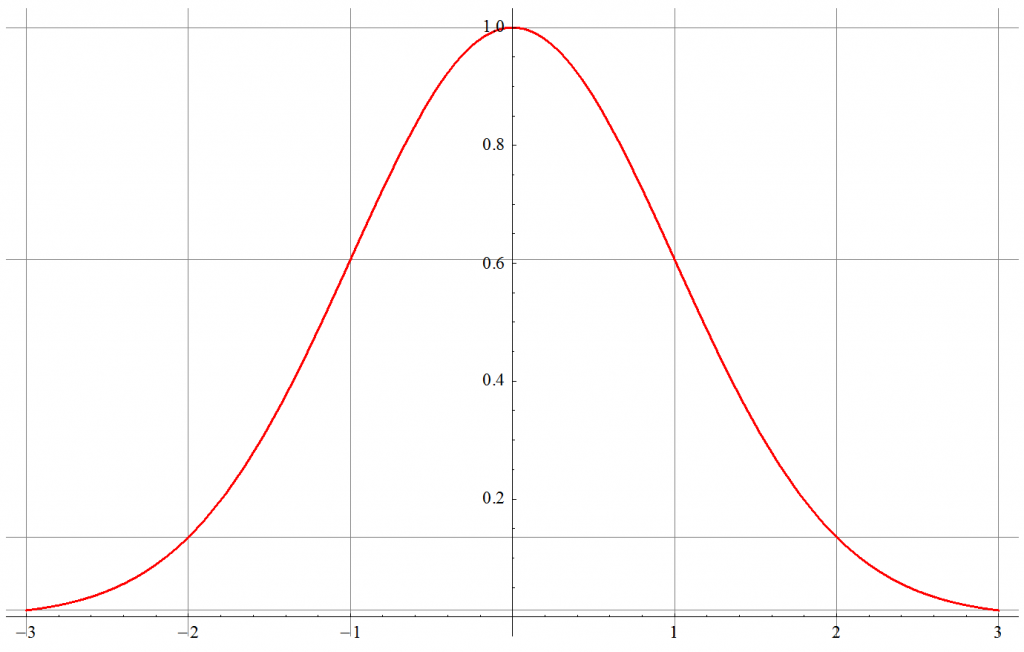
The value at the standard deviation σ is by definition the root-mean-square (RMS) value. Although many calculations of uncertainty are performed with RMS values, the ADC converts instantaneous values – this means a bit-error analysis needs to include ALL possible values … which is where the multiplier for σ comes into play (a reminder: a DC signal magnitude is its RMS value. A 1 V sine wave has an RMS value of 0.707 V; a 1V DC signal has an RMS value of 1 V)
If I really want to assure a best-guess and worst-case uncertainty analysis, I’ll define “ALL” as being 2 × 3.3σ to obtain the “Peak-to-Peak (PP) value. It is often desired to keep the maximum error to within ±½LSB … the resulting mapping of uncertainty would appear as shown:
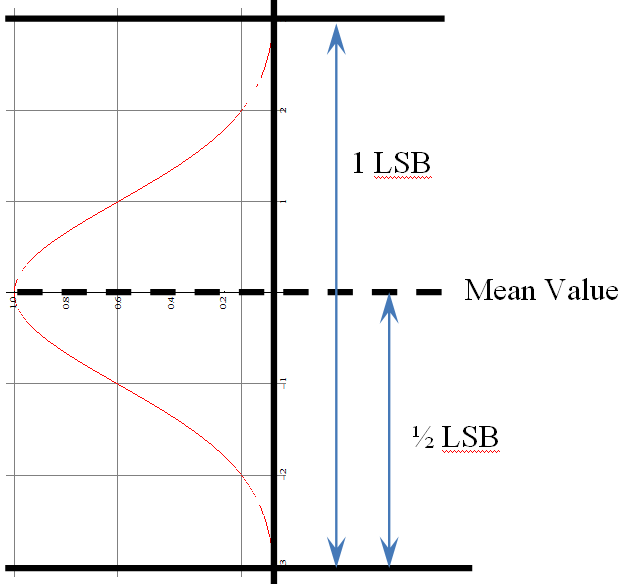
Consider a system in which the uncertainty limits are ±2 LSB. We have this (truncated on the high side) mapping as a result – showing 4 counts of noise.
All too often, our minds get focused on treating signal and noise separately. “Noise” is relatively small (hopefully) when compared to signal; it wiggles the lowest bits. This is emphasized by the realization that the “mean” of the Gaussian distribution is zero – and that we think in terms of a positive RMS value. I’ve observed instances where it was thought this was the proper mapping: the noise is “absorbed” by the lower bits leaving the reduced dynamic range available for signal.
The noise wipes out the usefulness of the lowest bits (PNK) and reduces the range of signal that may be converted (GRN).
Sigh …
However, this would be the proper mapping if there were no signal (and assuming the noise mean were shifted to the magnitude of 2 counts: mean ± 2 LSB.
Uncertainty is inherent in the system even with zero signal; in this illustration, the noise consumes 4 LSB. If this were an 8-bit converter, the dynamic range would be:
![]()
If it were a 16-bit converter
![]()
(if there were no uncertainty, the DR of the 16-bit converter would be 96.3 dB)
Now when a signal is applied, superposition principles hold and the effect of uncertainty is clearer.
The fallacy here is that the absolute value of uncertainty wouldn’t change; uncertainty of 4 counts in an 8-bit converter would become 1024 counts of uncertainty in a 16-bit converter: the DR would be essentially the same (63.75 vs. 64.00 ⇔ 36.09 vs. 36.12 dB)
Although the signal transformed to an “exact” binary representation, the uncertainty shows that any single measure may be as far as ±2 counts away from the “real” value. If the uncertainty is random with a normal distribution, averaging multiple samples will reduce the error; 4 samples will increase the resolution by 1 bit; it takes 16 samples to increase precision by 2 bits.
Note that “white noise” – by definition a noise with a normal distribution – is defined with an infinite bandwidth. Bandlimiting this noise – intentionally by filtering or unintentionally by the filtering action of a finite system – has different characteristics.
Averaging white noise – both thermal and shot noise are “white” noise sources – can reduce the overall effect by the square root of the number of samples. Flicker noise and its relatives do not fit within this category – the distributions are not Gaussian and a low number of samples invalidates the Central Limit Theorem assumption.
Limit Of Measure
In reality, SNR as a value has little meaning without context; dynamic range – the measure of the ratio between the maximum undistorted signal and the minimum resolvable signal, usually the noise floor – is more appropriate when defining the capabilities of a data converter. Noise in a system is usually relatively constant while a signal value may vary … which necessarily varies the SNR. “Weak” signals – those at the lower end of resolvability – by definition have low SNR.
Converters typical utilize some form of “HOLD” to maintain a constant sampled value during the conversion process. During the HOLD period, the information is quasi-DC; the RMS value of a DC signal is the value of the signal itself – but that value has a specific component of noise which at this point, is indistinguishable from signal: was the signal value 0.45 or was the true value 0.43 with 0.02 of that noise? How does that difference relate to LSB?
“Noise” will perturb the sampled value; over many samples, the probability distribution of the noise will determine an expected range of uncertainty in the measure. It is often assumed this variation is Gaussian in nature; this may not be true1.
Keeping in mind that the “noise floor” typically defines the lower limit of measure and the full scale range of the converter defines the upper limit, then resolvable signal range extends from the bit count of uncertainty to the bit count appropriate for the full scale range of the converter. The lowest bit count is 1, the least significant bit (LSB). The number of counts allowed to be consumed by the uncertainty will dictate the lowest resolvable signal – this uncertainty can be considered differential information riding on the common-mode signal.
That’s all for now.

1One project I worked on was a white noise generator for use in encryption systems (the EMI qualification people had a good time with that one). One of the issues was separating “noise” from noise … the decryption process could have problems if the noise+noise was not sufficiently equal to the noise itself. “Noise” is any part of a signal that is undesired. For this project, noise was signal, sinewaves were noise.